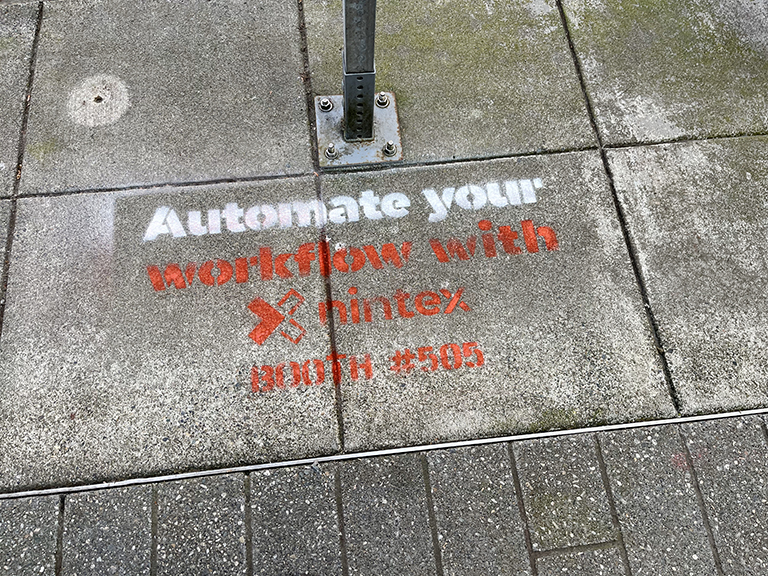
Wheat paste posting has a measurement reputation problem, and it is entirely solvable. The instinct to reduce every campaign outcome to a single impression count misses the complete picture of what street-level media actually produces in the world. We have measured posting campaigns from simple QR scan tracking through full mobile attribution studies and pre-post brand awareness surveys, and the results consistently show that wheat paste posting delivers impact that the impression metric alone does not capture, and in many cases, impact that matches or exceeds what equivalent digital display budgets produce on comparable metrics. This guide explains every measurement method available, what each one actually tells you, the real numbers we see in the field, and how to structure a measurement approach that justifies street-level media investment to any stakeholder who asks.
Why Raw Impression Counts Are an Incomplete Metric
The industry standard for outdoor advertising measurement is circulation, the number of vehicles or pedestrians passing within visible range of a placement during the campaign period. For billboards, this is calculated using Geopath traffic data and verified pedestrian count surveys. For wheat paste campaigns, it is estimated from foot traffic data in the zones where placements are concentrated.
Impression counts answer exactly one question: how many people could have seen the campaign? They do not answer whether the campaign’s audience paid attention, whether the placement generated any behavioral response, or whether the brand measurably benefited from the investment. A campaign with 500,000 estimated impressions and zero behavioral response is less valuable than a campaign with 50,000 qualified impressions that drove 500 QR scans and 2,000 website visits, and the second campaign almost certainly cost less. The measurement stack needs to go deeper than impressions to tell the story that matters for campaign optimization and stakeholder reporting.
Tier 1: Direct Response Tracking
QR Codes, The Primary Attribution Instrument
QR codes on wheat paste posters are the most accessible and most actionable direct measurement tool available for street-level campaigns. When a pedestrian scans the QR code, the event is logged with a timestamp and, depending on the platform, the device’s approximate location. Aggregate scan data provides a direct behavioral response signal from people who were within physical range of the poster and motivated enough to engage with it, a meaningfully different metric from estimated impressions of the population that passed through the zone.
In well-placed campaigns in high-pedestrian urban environments, we consistently see QR scan rates of 1 to 5% of estimated weekly impressions. A campaign with 50,000 weekly impressions in a high-engagement zone like Williamsburg Brooklyn, the Mission District in San Francisco, Silver Lake in Los Angeles, or Wicker Park in Chicago generates 500 to 2,500 QR scans per week. At a campaign cost of $5,000 for a two-week concentrated posting program in one of these zones, 1,000 total QR scans produces a $5.00 cost-per-engaged-impression, a metric that outperforms most paid digital display channels on this specific measure.
QR placement on the poster affects scan rates significantly. The optimal position is the lower third of the poster, between 4 and 5 feet from the ground, accessible to a standing pedestrian without reaching or crouching. Minimum size is 2 inches by 2 inches for reliable scan at normal pedestrian viewing distance (3 to 6 feet). Include a one-line instruction immediately adjacent to the code: “Scan for [event info / special offer / download].” Unmarked QR codes generate roughly half the scan rate of instructed codes at comparable placements in comparable zones. The instruction signals that scanning is worthwhile before the person commits to the physical action.
Unique URLs and UTM Parameters
Even without a QR code, unique URLs tied to specific campaigns provide web attribution. A URL like americanguerrillamarketing.com/campaign-X that appears on a poster drives traceable traffic in Google Analytics or equivalent analytics platforms when a viewer types it later. UTM parameter strings (utm_source=wheat-paste&utm_medium=ooh&utm_campaign=[name]) allow any analytics system to attribute sessions and conversions to the specific outdoor campaign.
In practice, typed URL response rates are lower than QR scan rates because manual typing creates friction. We recommend QR as the primary direct response mechanism and a short, memorable unique URL as secondary, serving the audience that photographed the poster and typed the URL later from their photo roll. Both together cover more of the behavioral response spectrum than either alone.
Dedicated Phone Numbers
For service-sector campaigns in legal, healthcare, home services, and financial services categories, a dedicated phone number on the poster provides a call attribution channel that routes to the client and tracks the response unambiguously to the outdoor campaign. Call volume from the dedicated tracking number is clean attribution, the caller encountered the poster and chose to act. In markets where the target demographic skews above 45, phone call tracking frequently outperforms QR code scanning as the primary response mechanism. Include both, dedicated phone number for the calling audience, QR code for the scanning audience, and measure each independently.
Tier 2: Mobile Attribution Studies
How Geofenced Behavioral Attribution Works
Mobile attribution platforms, PlaceIQ, Foursquare (Placed), Cuebiq, and similar services, maintain databases of anonymized mobile device location histories. When a brand runs a wheat paste campaign, these platforms can identify devices that were within a defined geographic radius of posting locations during the campaign period and subsequently took a measurable downstream action: visiting a retail location, browsing a specific website, opening an app, or completing a digital transaction.
The attribution model compares two populations: devices that spent time in the campaign zone (the exposed population) versus a statistically matched group of devices that were not in the campaign zone (the control population). If the exposed population converts to store visits at a 22% higher rate than the control population during the campaign period, that 22% represents the measured behavioral lift attributable to campaign exposure. This is population-level probabilistic attribution, it infers aggregate campaign impact from behavioral patterns rather than tracking individual exposure events.
In campaigns we have run with parallel mobile attribution studies, store visit lift from concentrated urban posting campaigns, 100+ placements within a 4-block radius around a specific retail location, has ranged from 12% to 28% above matched control areas. These are not universal benchmarks; they reflect high-saturation programs in specific high-pedestrian zones. Lower saturation and broader geographic spread produce smaller lift signals. The methodology requires a minimum sample size, campaigns with very low traffic volume in the attribution zone may not produce statistically reliable results from mobile attribution studies.
When Mobile Attribution Is and Is Not Appropriate
Mobile attribution studies are appropriate for campaigns with retail, app, or specific website conversion objectives; sufficient campaign saturation to produce measurable exposure in the target zone; a defined campaign geography that allows for clean control area comparison; and a budget for the attribution study itself (third-party attribution studies cost $2,000 to $10,000+ depending on scope and vendor). For small-budget, single-neighborhood campaigns, QR code and URL tracking provide more cost-effective direct measurement. Save mobile attribution studies for programs where the campaign investment justifies the measurement investment.
Tier 3: Brand Awareness Lift Studies
Pre/Post Survey Methodology
For campaigns where brand awareness is the primary objective, market entry programs, brand relaunches, category awareness initiatives, pre- and post-campaign awareness surveys provide the most business-meaningful measurement output available for outdoor media. A brand lift study surveys a sample of the target population in the campaign coverage area before the campaign launches, establishing baseline aided and unaided awareness levels. The same population (or a comparable sample from the same geography) is re-surveyed after the campaign concludes, measuring awareness change against the pre-campaign baseline and against a control population in a comparable geography without campaign exposure.
The lift metric, the percentage-point difference in brand recall between exposed and control populations, directly measures what the campaign contributed to brand knowledge. This answers the question that impression counts cannot: did more people know about the brand after the campaign than before it, and how much of that change can we attribute to the outdoor program?
In studies we have conducted alongside posting campaigns, typical awareness lift from concentrated posting programs in target neighborhoods ranges from 5 to 15 percentage points among regularly exposed audiences, people who live or work in the posting zone and encountered the campaign multiple times during its flight. This lift is meaningfully above the typical 1 to 3 percentage point lift measured from equivalent digital display budgets in comparable markets, reflecting the physical environment’s advantage in driving brand memory through repeated real-world exposure.
Social Listening as a Qualitative Amplification Signal
For campaigns with visually distinctive, photograph-worthy creative, social media mention tracking provides a qualitative amplification signal that accompanies the primary quantitative metrics. When people in the campaign zone photograph wheat paste posters and share them, which happens regularly in aesthetically engaged neighborhoods like Brooklyn, Silver Lake, Capitol Hill in Seattle, and Wicker Park in Chicago, the social share volume indicates that the creative is resonating beyond its direct impression footprint.
We track social mentions through hashtag monitoring and location tag analysis for campaigns where shareable creative is a deliberate design objective. Volume of organic social content is not a primary KPI, it is a secondary indicator of creative quality and cultural resonance. For entertainment launches, brand activations with strong visual identity, and campaign executions that are designed to generate conversation, organic social sharing from posting campaigns has in some cases generated more total social impressions than the direct physical campaign footprint, creating a genuine content amplification layer on top of the street-level impression base.
Tier 4: Sales Impact Attribution
In-Market Sales Velocity Comparison
For consumer packaged goods brands with distribution in specific markets, a geo-controlled sales lift study compares sales velocity during the posting campaign period in the campaign market versus comparable control markets without the campaign, controlling for distribution changes, pricing variations, and seasonal factors. When controls are properly implemented, the sales velocity difference between the campaign market and the control markets represents the posting campaign’s direct contribution to purchase behavior, the closest thing to direct ROI measurement available for street-level media.
The practical challenge is controlling for enough variables to isolate the posting campaign’s contribution from other concurrent marketing activity. Clean causal attribution requires a deliberately unexposed control market comparable to the campaign market in distribution penetration, base sales velocity, and all concurrent promotional activity. When those conditions are met, the measurement is genuinely predictive of campaign ROI. When they are not, when multiple campaigns are running simultaneously or when distribution changes during the measurement window, the attribution is confounded and the results are directional rather than causal.
Promo Code and Coupon Redemption Tracking
Campaign-specific promo codes included on wheat paste creative, “Use code STREET15 for 15% off your first order”, provide unambiguous transaction-level attribution regardless of the conversion channel. A customer who types the promo code at online checkout, in-store, or over the phone definitively encountered the campaign creative. The code works across all conversion mechanisms without requiring any additional measurement infrastructure beyond standard e-commerce or POS promo code tracking.
Promo code campaigns consistently outperform impression-only campaigns on stakeholder reporting value because the attribution is clean and the conversion data speaks the same language as digital campaign reporting. Redemption rate, revenue per redemption, and total campaign-attributed revenue are metrics that any business stakeholder understands, reducing the “how do we know the outdoor campaign did anything?” conversation to a simple reference to the redemption data.
Building the Right Measurement Stack
Not every campaign needs the full measurement stack. The right approach matches measurement capability to specific campaign objectives and budget constraints. Direct response campaigns need QR codes and URL tracking at minimum. Retail-objective campaigns benefit from mobile attribution studies when budget allows. Awareness campaigns need pre/post surveys to produce meaningful results reporting. Consumer packaged goods campaigns benefit from sales velocity comparison and promo code tracking simultaneously.
The universal minimum for any AGM campaign: GPS-documented installation photography with timestamps, providing proof of performance for every placement in the footprint. This documentation confirms what ran, where, and when, the foundation upon which all subsequent measurement layers are built. Contact us at americanguerrillamarketing.com/contact to discuss measurement design for your specific campaign objectives.
Frequently Asked Questions About Wheat Paste Posting Measurement
How do you estimate impressions for a wheat paste posting campaign?
We estimate impressions from verified pedestrian count data for the corridors and zones where placements are concentrated. In high-pedestrian zones like Williamsburg Brooklyn or Wicker Park Chicago, a 50-placement campaign in a 4-block radius can generate 30,000 to 100,000 weekly impressions depending on foot traffic volumes. These are estimates with defined uncertainty, the QR scan, URL visit, and attribution data are more directly meaningful for behavioral ROI reporting.
What QR scan rate can I realistically expect from a wheat paste campaign?
In well-placed high-pedestrian zone campaigns with properly designed QR code placement and explicit call-to-action text, 1 to 5% of estimated weekly impressions. Scan rates vary significantly by neighborhood culture, creative quality, and QR instruction clarity. Arts and entertainment districts consistently scan at higher rates than commercial or commuter-focused corridors.
Can wheat paste campaigns be measured the same way as digital advertising?
Not with identical methodology, but the measurement gap is smaller than most people assume. QR codes, unique URLs, promo codes, and mobile attribution studies provide behavioral data directly comparable to digital performance metrics. Brand lift studies use the same methodology applied to digital awareness campaigns. The main difference is that individual-level impression data is not available, measurement is population-level rather than user-level.
How long after a campaign ends does the measurement window stay open?
For QR codes and URL tracking, keep the measurement window open for 30 days after the campaign ends to capture delayed conversions from people who photographed the poster and acted later. For brand lift surveys, the post-campaign survey should run within 2 weeks of campaign conclusion to capture awareness before it fades. For mobile attribution studies, the exposure window closes at campaign end but the downstream behavior window (store visits, website visits) should remain open for 30 to 60 days.
What is the typical cost of a mobile attribution study for an OOH campaign?
Third-party mobile attribution studies range from approximately $2,000 to $10,000 or more depending on the platform, study scope, and geographic complexity. For campaigns with posting investments above $15,000 to $20,000 where stakeholder reporting requirements justify the measurement investment, the attribution study cost is a reasonable percentage of total program cost. For smaller campaigns, QR and URL tracking provide adequate measurement at effectively zero marginal cost.
Does AGM provide campaign measurement and reporting?
Yes. Every campaign includes GPS-documented proof-of-placement photography. For campaigns with direct response measurement requirements, we structure QR and URL tracking infrastructure. For brand lift and attribution studies, we partner with measurement vendors and help clients design appropriate study methodology. Contact us at americanguerrillamarketing.com/contact to discuss measurement design for your campaign.
Frequently Asked Questions
Measuring the Impact of Wheat Paste Posting: Beyond Impressions generates better results when placement, timing, creative, and local execution all work together. These questions cover the details brands usually need before launch, during rollout, and while evaluating performance.
Why are impressions alone not enough for wheat paste campaigns?
Impressions estimate possible exposure, but they do not show whether people acted, remembered the brand, or responded differently in one area versus another.
What metrics should be tracked alongside impressions?
Track QR scans, landing page traffic, promo code use, event turnout, store visits, social mentions, and placement survival.
How can geography improve measurement?
Breaking results down by neighborhood or route helps show which clusters of placements actually drove response instead of treating the whole city as one data point.
Does proof-of-placement matter for measurement?
Yes. Without documentation, it is hard to connect campaign performance to where the posters were actually installed and how long they stayed up.
Can wheat paste posting support direct-response goals?
Yes, if the creative includes a trackable next step and the landing experience is tight enough to convert attention into action.
How should brands judge campaign quality when the goal is awareness?
Look for repeated local visibility, brand recall signals, earned sharing, and whether the campaign strengthened presence in the intended areas.
What role does poster durability play in measurement?
Durability affects how long the audience can realistically encounter the message. A high-volume route that falls apart quickly may underperform a smaller route that stays visible.
Should results from wheat paste be compared with digital campaigns?
Yes, but carefully. The channels behave differently, so comparisons work best when they focus on outcome metrics like traffic or leads rather than surface-level media stats.
What is the best way to test and improve a wheat paste campaign?
Run a controlled first wave, compare responses by route or creative variation, and use those findings to refine the next placement plan.
What is the biggest mistake in wheat paste measurement?
Launching with no tracking setup. Once the posters are live, missing measurement infrastructure is hard to recover.
Related Pages and Articles