Guerrilla marketing ROI is measurable. It is also frequently measured badly, which is why so many brands either overstate results with inflated passive impression numbers or understate them by applying a digital-only measurement framework that ignores what physical campaigns actually produce. Getting the measurement right requires a different approach than what most digital marketing teams default to.
Physical presence in the real world creates multiple types of value simultaneously: direct response from people who act on what they see, market lift in the form of changed behavior in the geographic areas where the campaign ran, earned spread when people photograph and share what they encountered, and business outcomes that can be tracked back to the activation. A measurement framework that captures all four of those categories gives a more complete and defensible picture of ROI than one that counts only impressions.
Our team at American Guerrilla Marketing provides GPS-tracked documentation for every campaign we deploy. What follows is the measurement framework we recommend to clients planning campaigns from our base in Industry City, Brooklyn, NY, through to markets across the country.
Why Standard Digital Metrics Do Not Apply to Street Campaigns
Digital advertising metrics are built around trackable events: impressions served, clicks registered, conversions completed. The measurement chain is largely automatic because the medium is software. Every touchpoint generates a data point by default.
Street campaigns work differently. The primary contact between the brand and the audience happens in physical space with no automatic tracking. A person who sees a poster, reads a stencil, or receives a sample from a street team does not generate a data record by default. The measurement has to be built into the campaign design rather than extracted from the medium after the fact.
This is not a deficiency of guerrilla marketing as a format. It is a property of physical reality that requires a different measurement approach. Brands that try to force street campaigns into a pure digital measurement framework consistently undercount the value the campaign created and miscategorize the type of value it was designed to create.
The Passive Impression Problem
Many outdoor campaign reports rely on foot traffic estimates to calculate impression counts. The methodology typically works like this: the foot traffic data for an area suggests a certain number of people walk past a given location per day. Multiply that number by the campaign duration and the number of placements and you arrive at a large impression figure. The problem is that impression estimates measure theoretical exposure, not actual engagement. A campaign that generated fifty thousand theoretical impressions but zero QR scans and no measurable lift in any downstream metric may have been invisible in practice despite the large number.
The Four-Bucket Measurement Framework
The most useful guerrilla marketing ROI framework organizes measurement around four categories, each measuring a different type of value the campaign creates.
Bucket 1: Direct Response
Direct response measurement tracks actions that can be tied directly to specific campaign placements. This includes QR code scans from campaign-specific codes, vanity URL visits, offer redemptions from sampling interactions, form completions on campaign landing pages, and ticket or product purchases tied to campaign-specific promo codes. Direct response metrics are the most defensible form of guerrilla marketing ROI measurement because they connect a specific action to a specific campaign element with minimal ambiguity.
Bucket 2: Market Lift
Market lift measures changes in behavior in the geographic areas where the campaign ran during the campaign window. This includes foot traffic changes at locations near the campaign placements, regional branded search volume growth in the campaign markets, store visit data showing whether retail locations in the campaign geography saw increased traffic, and any direct sales lift in the campaign territories compared to baseline or to non-campaign markets in the same period.
Bucket 3: Earned Spread
Earned spread measures the organic amplification the campaign generated beyond the people who encountered it directly. This includes social media posts documenting the campaign (tracked through brand monitoring tools and hashtag analysis), press mentions in local or national media, creator or influencer coverage of the installation, and any documented instances of the campaign appearing in third-party content without a paid relationship.
Bucket 4: Business Outcome
Business outcome measurement connects the campaign to the specific business goal it was designed to advance: leads generated during the campaign window, sales in the campaign market during the campaign period, event attendance at activations the campaign supported, sampling conversion rates tied to street team interactions, or any other specific business metric the campaign was hired to move.
Building the Tracking Stack Before the Campaign Runs
Every measurement tool needs to be in place before the campaign deploys. Setting up tracking after the fact produces measurement gaps that cannot be filled retroactively. The pre-campaign setup checklist includes campaign-specific QR codes tied to dedicated landing pages, UTM parameters on all digital links the campaign references, a branded search baseline in the campaign markets from at least two to four weeks before the campaign starts, a current direct traffic baseline from the campaign geographies, and a brief for street team members covering what interaction data they need to collect and how.
The landing page the campaign QR codes link to should be built specifically for the campaign rather than redirecting to the general homepage. A campaign-specific page confirms what the audience saw on the street, creates a distinct URL that isolates campaign-generated traffic in analytics, and allows conversion behavior to be tracked cleanly without being mixed with organic site traffic.
Using Location-Specific QR Codes
If the campaign uses QR codes across multiple locations or multiple formats, assigning unique codes per placement location or per format type creates a level of response data that a single campaign-wide code cannot provide. Location-specific codes show which walls, which routes, or which neighborhoods generated the most scans, which informs route optimization for future campaigns and identifies the highest-performing placements within the current campaign.
For campaigns with large route counts, a simplified version of this approach is to assign one code per neighborhood cluster or per city rather than per individual placement. That still provides market-level response data without requiring dozens of unique code setups.
Measuring Branded Search Lift
Branded search lift is one of the cleanest market lift signals available for guerrilla marketing campaigns because it measures the audience that sought out the brand by name after encountering the campaign. If branded search volume in the campaign market increases during the campaign window compared to the baseline period and compared to non-campaign markets in the same period, that lift is attributable to the campaign with reasonable confidence.
This measurement requires establishing the baseline before the campaign begins. Tools like Google Search Console (for traffic to owned properties), Google Trends (for relative search volume changes), and third-party keyword tools that show city-level search volume changes all contribute to this analysis.
Documenting the Campaign for Reporting
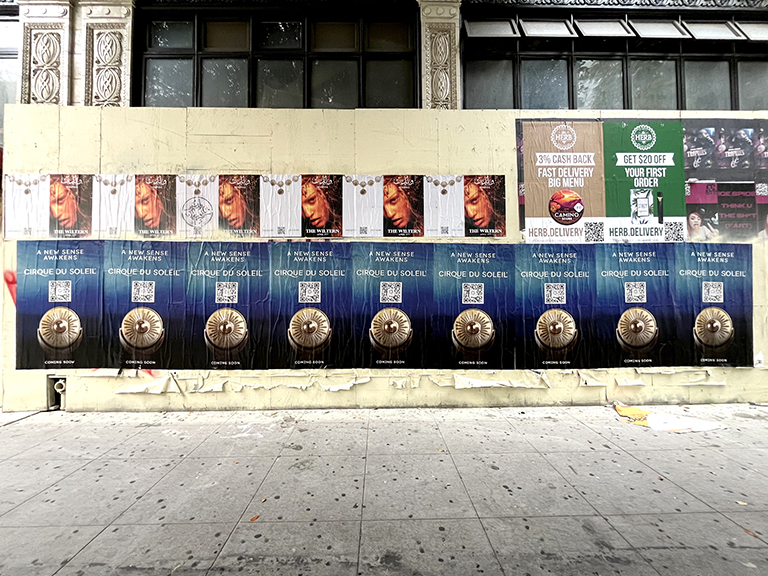
Visual documentation is not separate from measurement. It is part of the measurement package because it provides verifiable evidence that the campaign ran as specified and creates the permanent record that stakeholder reporting requires. GPS-verified photos at each placement location with timestamps, route maps showing the full campaign geography, and photo logs from street team activations collectively form the visual evidence layer of the measurement package.
Our team delivers full documentation packages with every campaign deployment. These packages include timestamped photography organized by location, GPS coordinates for each placement, route maps for the full activation geography, and a written summary of what was deployed, when, and where. That documentation is the foundation clients use to build campaign reports for leadership, agencies, or investor updates.
Foot Traffic Correlation and Location-Specific Analysis
For campaigns near retail locations, events, or other places where foot traffic can be monitored, correlation between campaign geography and measured foot traffic changes provides one of the more direct signals of campaign effectiveness. If foot traffic at a retail location increases during the campaign window compared to the same period in prior weeks or months, and the increase is concentrated in the neighborhoods where the campaign ran, the correlation is worth including in the campaign report even if strict causal attribution is not possible.
Third-party foot traffic data tools can provide neighborhood-level pedestrian volume data that allows pre-to-post campaign comparison in the campaign territory versus non-campaign territories in the same market. This type of market lift analysis is a standard part of how major OOH campaigns are measured, and the same methodology applies to guerrilla marketing activations when the placement geography is sufficiently concentrated to isolate the campaign territory from the rest of the market.
Store Visit Attribution
For retail clients, store visit attribution tools that tie mobile device location data to physical store visits can estimate the number of devices that encountered the campaign geography and subsequently visited the retail location during the campaign window. This methodology has limitations and requires third-party data tools, but it can provide an approximation of the offline-to-store conversion contribution of the street campaign that QR codes alone cannot capture because most store visitors will not scan a code before walking in.
Earned Media Valuation in the Measurement Package
Guerrilla marketing campaigns that generate press coverage, organic social sharing, or creator content create earned media value that supplements the direct response and market lift metrics. Earned media valuation is not an exact science, but some commonly used approaches assign a multiplier to the estimated advertising value equivalent of the earned coverage: what would it cost to generate the same reach through paid media?
For reporting purposes, earned media contribution is best presented as a supplementary metric rather than a primary ROI driver, because the valuation methodology involves assumptions that not all stakeholders will accept at face value. Present the earned coverage as documented evidence (links, screenshots, view counts where available) alongside the direct response and business outcome data rather than converting it to a dollar figure that may seem inflated.
Social Documentation as Campaign Evidence
Every organic social post that documents a campaign installation is evidence of reach beyond the QR scan count. A post from a neighborhood resident with three thousand followers that shows the campaign art and gets eighty interactions has reached an audience that did not scan a code and is not captured in any direct response metric. Collecting and organizing that organic documentation during and immediately after the campaign window creates a social evidence file that adds qualitative depth to the quantitative reporting package.
Building a Campaign Measurement Database Over Time
Brands that run guerrilla marketing campaigns regularly should maintain a measurement database that accumulates data across multiple activations. That database becomes increasingly valuable with each campaign because it provides benchmark data for evaluating new campaigns, identifies patterns in which formats and markets perform consistently, and reveals the conditions under which response rates are highest.
A measurement database for guerrilla campaigns typically tracks campaign date and duration, market and neighborhood, format types deployed, placement count by format, QR scan totals and rates, landing page conversion rates, any market lift signals observed, business outcome metrics, and total campaign cost. Over five or ten campaigns in a given market, the database shows clear performance patterns that make planning dramatically more efficient than starting fresh each time.
Sampling and Street Team Interaction Measurement
Street team activations create a form of direct response measurement that static formats cannot match because every interaction is an event with a potential data record attached to it. Teams that collect interaction data, whether through tally counters, handout card tracking, QR scan records, or digital sign-up captures in real time, produce a data set that is much richer than the aggregate impression estimates that static format campaigns typically rely on.
For sampling campaigns, the most useful interaction metrics are the total number of samples distributed, the percentage of sample recipients who scanned the QR code or provided contact information, and the downstream conversion rate among those who took both actions. This three-level funnel (sample distributed, digital action taken, conversion completed) maps the street team interaction directly to business outcomes in a way that makes the ROI calculation straightforward even for stakeholders who are skeptical of guerrilla marketing measurement generally.
Interaction Quality vs. Interaction Volume
Street team measurement should distinguish between high-quality and low-quality interactions. A high-quality interaction is one where the team member had a full conversation, distributed a sample, collected a response (scan, sign-up, or card), and documented the exchange. A low-quality interaction is a sample hand-off with no conversation and no follow-up capture. The ratio of high-quality to low-quality interactions is a measure of team briefing effectiveness and team performance that is as useful as total interaction volume for evaluating and improving future activations.
Cost Per Meaningful Impression
Cost per meaningful impression is a more honest metric for evaluating guerrilla marketing investment than a standard outdoor CPM because it focuses on encounters that created genuine awareness rather than theoretical exposure. The calculation is simple: divide the total campaign cost by the estimated number of real, high-attention contacts the campaign created. The “meaningful” qualifier filters out the passive walk-bys that registered the campaign at zero depth from the encounters where someone actually noticed, read, or responded to the creative.
This metric often looks favorable for guerrilla marketing campaigns compared to passive media because street-level work in the right location creates genuine attention rather than background noise. A poster on a wall that three hundred people read and five people photograph is producing more meaningful contact per placement than a billboard seen peripherally by thousands of commuters.
Cross-Channel Attribution When Digital and Street Run Together
Many campaigns run street-level guerrilla activations simultaneously with paid digital campaigns in the same markets. When both channels are running together, attribution becomes more complex because the audience that converts may have encountered both the street campaign and the digital campaign before taking action. Strict last-click attribution in digital analytics will assign conversion credit to the digital touchpoint while completely ignoring the street-level exposure that may have been the primary driver of brand awareness and intent.
A more honest cross-channel attribution approach acknowledges the contribution of both channels without claiming false precision about which specific touchpoint drove each conversion. Markets where both channels ran should show stronger conversion rates than markets where only digital ran, and that differential is one of the cleaner signals of the street campaign’s incremental contribution. Present this market comparison in the campaign report alongside the direct response data from both channels rather than trying to force a single attribution model that the data cannot honestly support.
How to Report Results Without Inflating Passive Impressions
Good guerrilla marketing reporting tells an honest story about what the campaign was designed to do and what it actually produced. That story should include a clear statement of the campaign objective, the formats deployed and their exact geography, the direct response data collected, any market lift observed in the campaign territories, the business outcome metrics relevant to the campaign goal, and a forward-looking section on what the data suggests for the next campaign.
Reports that rely primarily on impression estimates and have nothing else to show are typically reporting campaigns that were not designed for measurement from the start. Brands that make measurement a design requirement of the campaign brief, rather than an afterthought, end up with reports that are specific, defensible, and useful for planning.
Avoid the temptation to compare street campaign impression estimates to digital CPM benchmarks directly. The formats are not measuring the same thing. A meaningful street encounter and a two-second social ad impression are different categories of contact. Reporting should reflect the actual nature of the contact the campaign created rather than forcing it into a digital framework that was not built for physical media.
Connecting Measurement to Campaign Improvement
The most valuable thing measurement data does is inform the next campaign. Which placements generated the most QR scans? Which neighborhoods showed the most branded search lift? Which street team routes produced the highest interaction counts? Which format drove the most landing page completions?
Those answers are the brief for the next activation. Campaigns that are measured well get smarter over time because the data set builds a picture of what works in specific markets, specific formats, and specific audience contexts. Campaigns that are not measured well start from scratch every time.
For brands running regular guerrilla marketing activity, maintaining a campaign measurement database across multiple activations creates compounding planning advantages. Market-level response patterns, format performance benchmarks, and route effectiveness data from past campaigns all become inputs to future campaign planning that make each successive activation more efficient than the one before it.
Frequently Asked Questions
How do you measure guerrilla marketing ROI?
Measure guerrilla marketing ROI through four primary buckets: direct response (QR scans, vanity URL visits, offer redemptions), market lift (foot traffic changes, regional branded search growth, store visit data), earned spread (social posts, press mentions, organic sharing), and business outcome (leads, sales, event attendance, sampling conversion). The measurement framework should be set up before the campaign runs so baseline data is available for comparison.
Can QR codes accurately track guerrilla marketing campaign results?
QR codes are one of the most reliable direct response tools for outdoor campaigns when implemented correctly. Campaign-specific QR codes, unique per format or per location, allow brands to attribute scans to specific placements and routes. QR tracking understates true reach because many people who notice a campaign do not scan, but it accurately measures the audience that responded.
What is cost per meaningful impression in guerrilla marketing?
Cost per meaningful impression measures what it cost to create a physical encounter that a real person actually noticed, remembered, or acted on, as distinct from a passive CPM that counts every theoretical passerby. Guerrilla marketing often delivers a favorable cost per meaningful impression because street-level placements in the right location create high-engagement encounters rather than background exposure.
What is the biggest mistake brands make when measuring guerrilla marketing?
The biggest mistake is using a passive impression estimate as the primary success metric. Impression estimates for outdoor campaigns are often derived from general area foot traffic data rather than actual observed engagement with the specific placement. Measurement should focus on what people actually did in response to the campaign, not how many people theoretically could have seen it.
How should a brand set up measurement before a guerrilla marketing campaign launches?
Before launch, set up campaign-specific QR codes tied to a dedicated landing page, establish a baseline for branded search volume in the campaign market, note current direct traffic levels from the target geography, set up UTM parameters for any digital touchpoints the campaign references, and brief the street team on what interaction data they need to collect. All of this needs to be in place before the campaign deploys so the pre-campaign baseline is clean.
What does good guerrilla marketing reporting look like?
Good reporting combines GPS-verified photos at each placement location with timestamps, route maps showing full campaign geography, direct response data (QR scans, URL visits, offer redemptions), market behavior data (lift in foot traffic, branded search, or sales in the campaign territory), and an honest assessment of what the campaign was designed to do and whether it did it. The report should avoid inflating passive impression estimates and focus on what the physical presence demonstrably produced.