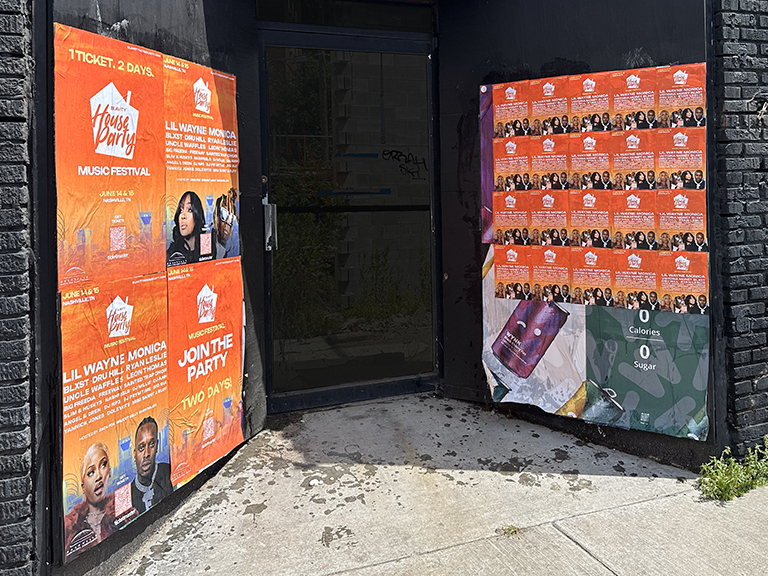
Flyposting is one of the most effective outdoor advertising formats for reaching high-quality urban audiences. It is also one of the formats that advertising buyers most often struggle to connect to measurable outcomes. The physical, non-tracked nature of street-level poster placement creates a measurement gap that causes some brands to undervalue the format relative to digital channels where click-through and conversion tracking is automatic.
The measurement gap in flyposting is not a fundamental limitation of the format. It is a planning and reporting problem. Our team at American Guerrilla Marketing has built wheat paste poster campaigns with comprehensive measurement frameworks that quantify impression delivery, track direct response, and measure organic social amplification. This guide covers the full ROI measurement framework for professional flyposting campaigns: what to track, how to estimate it, and how to build reporting that connects street-level activity to business outcomes.
The Three Measurement Tiers for Flyposting ROI
A complete flyposting measurement framework operates across three tiers: impression-based metrics, direct response metrics, and earned media metrics. Each tier captures a different dimension of campaign value, and a complete ROI picture draws on all three.
Tier One: Impression-Based Metrics
Impression estimates are the baseline measurement for flyposting ROI. An impression in flyposting is defined as one potential exposure, meaning one pedestrian passing within sight of a poster placement during the campaign period. The calculation is straightforward: estimated daily foot traffic at a location, multiplied by the number of days the placement ran at that location, summed across all campaign locations.
Foot traffic estimates for campaign locations can be sourced from city open data pedestrian counts, transit authority ridership data that proxies for adjacent corridor traffic, commercial foot traffic data services, or direct observation counts during scouting. The resulting impression estimate is necessarily an approximation, but it provides a consistent basis for comparing campaign scale and evaluating cost-per-impression against other advertising formats.
The cost-per-impression benchmark for flyposting campaigns in major urban markets typically falls between $0.001 and $0.01, placing it in a favorable range relative to many traditional and digital advertising formats when evaluated against comparable audience quality.
Tier Two: Direct Response Metrics
Direct response measurement for flyposting campaigns requires specific tracking mechanisms built into the campaign creative before print production. The most commonly used mechanisms are QR codes, unique URL slugs, and location-specific promo codes.
QR codes on poster creative create a direct, trackable path from physical exposure to digital engagement. A person who scans a QR code on a street poster demonstrates active engagement rather than passive exposure. QR code scans can be attributed to specific locations if each placement uses a unique QR code or if the QR code destination tracks referral location data. This attribution allows the campaign to identify which locations are generating the highest scan-through rates, providing data for future location prioritization decisions.
Unique URL slugs such as brandname.com/nyc or brandname.com/la serve a similar function for campaigns where QR codes are not appropriate for the creative format. Promo codes printed on campaign posters, such as “Use code STREET20,” can be tracked through e-commerce or ticketing systems and attributed to the flyposting campaign with reasonable confidence.
Tier Three: Earned Media Metrics
Organic social media amplification from flyposting campaigns is a meaningful and often underreported source of campaign value. When a well-designed poster installation in a high-visibility location generates photography and social sharing from passersby, the brand’s message reaches the followers of those photographers at no additional cost. The impressions delivered through organic social amplification can equal or exceed the direct foot traffic impressions for campaigns with strong photography-worthy creative.
Measuring organic social amplification requires monitoring campaign-related hashtags, mentions, and location tags during and after the campaign period. Setting up searches for the campaign creative’s key visual elements, the brand name combined with the campaign market, or any campaign-specific hashtag promoted in the creative gives a baseline count of organic social content generated by the campaign.
Building a Campaign Attribution Framework
Attribution in flyposting is more challenging than in digital advertising, where each click generates a trackable event. But a structured attribution framework can connect flyposting activity to business outcomes with enough rigor to support investment decisions.
Geographic Attribution
One of the most practical attribution approaches for flyposting is geographic: comparing sales, ticket purchases, app downloads, or other conversion events in the campaign neighborhoods against comparable control neighborhoods where the campaign did not run during the same period. If conversions in campaign neighborhoods increase significantly relative to the control neighborhoods during the campaign period, the lift is attributable to the campaign within a reasonable confidence range.
This geographic attribution approach works best for brands with the data infrastructure to measure conversion activity at a neighborhood level, such as e-commerce brands with delivery address data or ticketing platforms with venue proximity data.
Time-Period Attribution
A simpler attribution method is comparing conversion metrics during the campaign period against the period immediately before and after the campaign ran. A measurable lift during the campaign window that returns to baseline after the campaign ends is consistent with campaign attribution, though it cannot rule out other concurrent factors without more rigorous controls.
GPS Documentation as the Foundation of ROI Reporting
The GPS-tagged photo documentation that professional flyposting campaigns generate is the foundation of client-facing ROI reporting. Every placement documented with a GPS-tagged photo, organized by location and formatted into a campaign report, provides the evidence base that supports all other ROI claims.
Without GPS documentation, ROI reporting for flyposting rests on operator representations about where and how many placements ran. With GPS documentation, the claim is verifiable: the client can see exactly where each placement ran, on what date, and at what location. This transparency is the basis for client confidence and the primary reason that professionally documented flyposting campaigns command premium rates relative to undocumented alternatives.
Building the Campaign Report
The standard flyposting campaign report delivered by our team includes the following components: a geographic map of all campaign placements with numbered location markers, GPS-tagged photos for every placement organized by neighborhood, a summary impression estimate for the full campaign with methodology notes, direct response data where applicable, social media amplification data, and a campaign summary narrative covering execution highlights and any relevant performance observations.
The visual documentation is the most powerful component of this report for most clients. Seeing the campaign in the streets of their target city, with proof that it ran where it was planned to run, is a qualitatively different client experience than receiving an impression estimate with no visual evidence. Our guerrilla marketing reporting standard treats GPS documentation and visual evidence as non-negotiable components of every campaign deliverable.
Frequently Asked Questions
How do you measure ROI for a flyposting campaign?
Flyposting ROI is measured through impression-based metrics (location foot traffic estimates multiplied by campaign duration), engagement metrics (social media amplification from organic photography and sharing), and direct response metrics (promo code redemptions, QR code scans, or geographic correlations with sales lift data during the campaign period).
What is a typical cost-per-impression for flyposting campaigns?
Cost-per-impression for professional flyposting campaigns typically ranges from $0.001 to $0.01 depending on market, location quality, and campaign duration. In high-traffic urban markets, a well-placed campaign running two to three weeks can generate hundreds of thousands of impressions at competitive cost-per-impression rates.
How do you estimate impressions for a flyposting campaign?
Impression estimates are calculated by multiplying estimated daily foot traffic volume for each location by the number of campaign days that placement ran at that location. Total campaign impressions sum all individual location estimates. Foot traffic estimates are sourced from city pedestrian count data, transit ridership proxies, or commercial foot traffic data services.
What direct response mechanisms work with flyposting campaigns?
The most effective direct response mechanisms are QR codes that track scans by location, unique URL slugs or promo codes attributable to the flyposting campaign, and geofenced digital advertising that activates for people physically present in campaign locations.
How does social media amplification factor into flyposting ROI?
Social media amplification creates earned media value that extends beyond the campaign’s direct impression count. Tracking campaign-related organic social content during and after the campaign period quantifies this earned media value as part of total campaign ROI.
What is the best way to report flyposting campaign results to a client?
The most effective report combines GPS-tagged photo documentation with a geographic map of campaign coverage, impression estimates by location and total, direct response data where applicable, and social media amplification data. The visual documentation is typically the most compelling component for building client confidence.
How does flyposting ROI compare to digital advertising ROI?
Flyposting delivers strong cost-per-impression performance in high-traffic urban markets, particularly compared to premium digital placements targeting similar urban demographics. The audience quality argument for flyposting is also meaningful: a pedestrian who encounters a poster during their daily neighborhood walk is in a different mindset than someone who encounters a digital ad during content consumption. The physical presence of flyposting in the lived environment creates a brand signal that digital advertising cannot replicate, and that signal contributes to outcomes that pure impression counts do not capture.