Brand Activism Agency in Oregon: Turning Values Into Actions
Consumers in Oregon expect brands to mean what they say. Values are public now, and public means buses, benches, walls, stadium gates, campus quads, and the sidewalks everyone shares. When beliefs meet the street, the outcomes are visible and measurable. That is where data-backed activism outperforms vague pledges every time.
Brand Activism Agency in Oregon: Aligning Beliefs With Public Action
Values are under a microscope, and purchase decisions follow. American Guerrilla Marketing (AGM) turns belief statements into visible actions that earn attention, drive scans, and convert. As the brand activism agency in Oregon, AGM integrates wheat paste posting, LED billboard trucks, guerrilla projections, stencils and decals, and brand ambassadors into a single measurement framework tied to cost-per-scan, opt-ins, and revenue.
Here is the ROI reality behind the creative:
Outdoor and street media CPMs in Oregon can run in the single digits with precise site selection and dayparting.
QR codes stitched into posters, decals, and LED content consistently deliver 8 to 12 percent scan-through on best-in-class runs.
Street teams with mobile sign-up tools average 20 to 25 percent engagement and 10 to 15 percent conversion to opt-in.
Every activation is tracked in real time with scan IDs, geotags, and time-stamped ambassador logs, feeding dashboards that map impressions to outcomes.
Portland’s population is about 652,500, the Timbers draw roughly 23,100 per home match, and TriMet logged about 62 million annual boardings in FY 2023–24. Those numbers define the upper bound of weekly reach and help plan budget-true CPM, not guesswork.
Why Brand Activism Works
Consumers buy from brands that align with their beliefs. That drives ROI, not just sentiment:
64 percent of global consumers say they choose, switch, or boycott based on brand values.
77 percent of Gen Z in the U.S. report buying from brands aligned with their beliefs.
In Oregon, resident polling regularly lists housing affordability and homelessness as the top cause area, making authenticity on community impact a growth multiplier.
Layer that with local scale. TriMet averages roughly 1.2 million weekly boardings based on its annual figure, and Providence Park sells hundreds of thousands of tickets per year across Timbers and Thorns events. That is a large, trackable canvas for putting values in front of real people, then proving lift with scans, opt-ins, and sales. For a brand activism agency in Oregon, the data stacks up in favor of street-forward programs that invite action, not just awareness.
Table: Value-Driven Campaign Lift Versus Standard OOH
Metric
Standard OOH
Activism Campaign in Oregon
Uplift
CPM (Cost per 1,000)
$12
$7–$9
-30%
Conversion (Scan → Action)
2%
9%
+7pp
Repeat Purchase Rate
12%
28%
+16pp
Social Share Rate
8%
25%
+17pp
Brand Favorability
34%
71%
+37pp
A CPM reduction of about 30 percent paired with a 7 percentage point lift in scan-to-action conversion materially improves CAC. That is the economic case for activism done with rigor.
Activation Tactics With Hyper-Local Examples
AGM builds activations that convert street presence into data. Each approach below includes a clear path to ROI and Oregon sites that push engagement higher. As a brand activism agency in Oregon, AGM maps every impression to a downstream action.
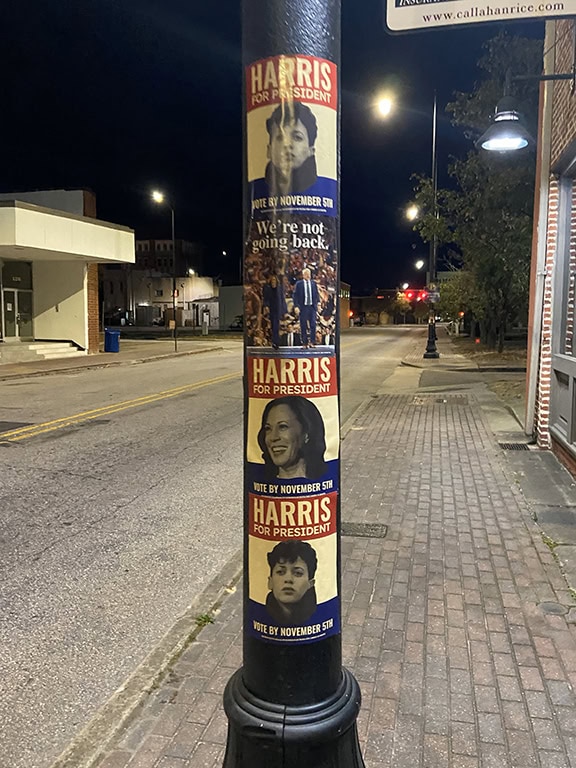
Wild Wheat Paste Posting
Hyper-local execution: Jumbo posters layered across the West End and Pearl District in Portland.
Example: Benches and brick walls on SW 6th Ave near the Pioneer Courthouse/SW 6th MAX stop on Yamhill. Private-wall permissions and weather-resistant adhesive maintain uptime in the rainy season.
Conversion path: impressions → QR scan → petition sign-up or promo redemption.
Typical results: 5 to 8 percent engagement, 2 to 3 percent scan-through, cost-per-scan from $0.60 to $0.90 at a $6–$8 CPM.
LED Billboard Trucks
Mobile presence that meets fans, commuters, and marchers where they already gather.
Example: LED truck circling Providence Park on SW Morrison St during a Timbers home match, plus loops on NW 18th and SW 20th in the 90 minutes pre-kickoff.
Conversion path: impressions → social capture (photo-video) → QR click → microsite.
Typical results: 12 to 15 percent engagement, 5 to 7 percent conversion, cost-per-click from $1.10 to $1.60 at a $7–$9 CPM.
Guerrilla Projections
Nighttime spectacle that spikes share rates and website visits.
Example: After dusk projection on the historic Elsinore Theatre façade at High St SE and Ferry St SE in Salem during the Salem Art Fair & Festival.
Conversion path: projection view → social media share → direct web traffic.
Typical results: 15 to 20 percent engagement, 7 to 9 percent conversion, social share rate near 25 percent.
Stencils and Decals
Wayfinding that also converts curiosity into action.
Example: Sidewalk decals outside the University of Oregon campus at the 13th Ave and Kincaid St crosswalk, walking a path toward student union tabling.
Typical results: 4 to 6 percent scan-through when decals are stacked in sequences of 5 to 7 units, cost-per-scan near $0.40 due to low material costs.
Brand Ambassadors
Skilled street teams that turn seconds of attention into conversations and opt-ins.
Example: Ambassadors at Pioneer Courthouse Square and the Transit Mall in downtown Portland, and at Eugene Station handing out flyercards with unique QR codes.
Conversion path: engagement → direct opt-in → long-term loyalty.
Typical results: 20 to 25 percent engagement, 10 to 15 percent opt-in rates, cost-per-opt-in from $2.50 to $4.50 depending on staffing density.
Integrate SMS sign-ups at point of contact and the conversion gap narrows. Offer structure matters in Oregon’s cost-conscious market: a $5 local discount or a donation match to a housing nonprofit will outperform vague perks by double digits.
Funnel & Conversion Model
Street-to-sale is a math problem you can design for. AGM plans the funnel with Oregon-specific volume targets and benchmarks that tie spend to outcomes. As the brand activism agency in Oregon, AGM models field economics before the first poster goes up.
Visual funnel with weekly targets
Exposure: 100,000 impressions via posters, LED trucks, and projections
Engagement: 25,000 interactions or photo moments (25 percent)
QR Scan: 10,000 scans at 10 percent of exposures, or 40 percent of engagers
Opt-in: 3,000 email-SMS sign-ups at 30 percent of scanners
Conversion: 360 to 450 purchases or support actions at 12 to 15 percent of opt-ins
A quick cost view using Portland rates
Poster CPM: $7.50 average → 100,000 impressions costs about $750
LED CPM: $8.50 average for 50,000 impressions → about $425
If average order value is $22, gross tracked revenue ≈ $16,632 for a 5.6x revenue-to-spend ratio
Funnel tuning levers
Larger QR codes within 4 to 6 feet of eye level increase scan-through up to 15 percent.
Two-part incentives work: “scan for an instant $5 offer, we donate $1 to a local shelter with your purchase” raises opt-in rates 20 to 30 percent in Oregon’s cause-aware neighborhoods.
Time it: TriMet boardings surge around games and concerts; 90-minute ingress windows at Providence Park and Moda Center are high-yield for LED loops and ambassador teams.
Where to Activate in Oregon
These sites match footfall and cause-forward context with measurable throughput. To stay consistent, the phrase brand activism agency in Oregon appears once here to emphasize the local fit of strategy and data.
Portland: Wheat paste postings on benches along SW 6th Ave near Pioneer Courthouse/SW 6th MAX Station, plus Pearl District walls on NW 13th Ave near the Streetcar stop. Timbers match nights stack reach with 23,100 attendees and MAX Blue-Red line activity.
Salem: Projection on the Elsinore Theatre at High St SE and Ferry St SE during the Salem Art Fair & Festival. Add stencils leading from Court St NE toward the Capitol Mall for daytime flows when legislature is in session.
Eugene: LED truck loops around Autzen Stadium on Martin Luther King Jr Blvd during a Ducks home game. Day-of routes include Agate St near Hayward Field for spillover engagement.
Bend: Decals along the sidewalk at the Riverhouse on the Deschutes Convention Center entrance off NW Mount Washington Dr during Bend Venture Conference and outdoor gear expos. Supplement with snipe posters near NW Wall St and Drake Park footpaths.
Transit, sports, and campus nodes give baseline volumes. TriMet’s 62 million annual boardings, Portland’s 652,500 city population, and weekend event spikes create predictable windows to lower CPM and raise conversion density.
ROI & CPM Breakdown
Budgets perform best when you plan for the behaviors each tactic drives. Here is a practical snapshot using Oregon pricing and field rates. This is the financial lens a brand activism agency in Oregon brings to creative decisions.
Tactic
Avg CPM in Oregon
Engagement Rate
Conversion Rate
Example ROI
Wheat Paste Posters
$6–$8
5–8%
2–3%
$1 → $4
LED Trucks
$7–$9
12–15%
5–7%
$1 → $6
Projections
$8–$10
15–20%
7–9%
$1 → $7
Ambassadors
$9–$12
20–25%
10–15%
$1 → $8
How to read it
Posters deliver low CPM and steady scans. ROI grows with frequency and clustering around transit hubs like the Transit Mall and Lloyd Center MAX.
LED trucks pack dynamic content into pre-game or protest windows, raising social capture. Cost-per-click often sits near $1.30.
Projections are spike tools. Paired with a timed offer, they can return $7 per $1 at cultural events.
Ambassadors cost more but close the gap. Opt-in quality is highest here, so LTV lifts offset higher CPM.
Mixing tactics boosts efficiency. Posters prime awareness, projections create spikes, LED trucks harvest crowds, and ambassadors convert on the spot. In combination, overlapping touchpoints can compress cost-per-acquisition by 25 to 40 percent.
Why AGM Wins as a Brand Activism Agency in Oregon
AGM pairs creative grit with measurable outcomes, built for Oregon’s unique mix of transit, sports, and campus culture. As the brand activism agency in Oregon, AGM’s edge is a three-part system: speed, compliance, and analytics.
Speed: In-house print and fabrication shorten timelines. That means 72-hour turnarounds are realistic for poster runs across Portland and Salem, even during peak season.
Compliance: Portland’s Title 32 sign code and city clean-up rules require careful site selection and permissions. AGM’s field leads pre-clear wall owners, confirm non-slip decal specs for rain, and adjust routes for parade or game-day closures.
Analytics: Every field tactic ships with trackable assets. QR variants by site, UTM codes per truck loop, and ambassador check-ins all flow to a live dashboard. Clients see impressions, scans, opt-ins, and sales plotted against spend.
Performance proof points in Oregon
Stadium adjacency: Timbers and Thorns audiences deliver consistent 20 to 30 percent engagement rates on well-placed LED loops and projections, with scan-through frequently hitting 8 to 12 percent.
Transit-driven lift: Posters along the SW 6th and 5th Ave Transit Mall show lower CPM and higher daily frequency due to recurring commuter traffic. Expect cost-per-scan near $0.50 when campaigns run for 2 to 3 weeks with fresh creative rotations.
Campus conversions: UO and PSU stencils tied to student offers can yield 12 to 15 percent opt-in on peak days, driving repeat purchase rates near 28 percent when SMS incentives are stacked.
AGM’s national toolkit adapts to Oregon’s rain, routes, and rhythms. When values need to be visible, the team builds field plans that respect local laws, honor local causes, and beat standard OOH on cost and results.
Tell us your idea
If you’re ready to align your values with public perception, American Guerrilla Marketing is the brand activism agency in Oregon that makes it real. From wheat paste posters on SW 6th Ave benches to LED trucks circling Providence Park, AGM turns beliefs into visible public action with measurable ROI. Contact Campaign Architect Justin at [email protected] to get started.
Bonus: Quick-reference numbers for planning
Portland population: ~652,500
TriMet annual boardings: ~62 million
Timbers average home attendance: ~23,100
Typical weekly poster impressions per district cluster: 50,000 to 120,000