The most common objection to guerrilla marketing investment is that it cannot be measured. That objection was more valid fifteen years ago than it is today. With proper attribution infrastructure built into the campaign from the start, guerrilla marketing ROI is measurable with meaningful precision across multiple metrics: impressions, consumer interactions, coupon redemptions, QR code conversions, geo-coded sales lift, and matched market analysis. The brands that cannot measure their guerrilla marketing campaigns are the ones that did not build measurement into the plan before the first ambassador hit the street.
At American Guerrilla Marketing, every campaign we execute includes a documentation and reporting layer that produces a measurable performance record. This includes GPS-stamped location data, timestamped photography, consumer interaction counts, and digital tracking integration when applicable. Post-campaign reports give clients a defensible performance record, not a rough estimate.
This guide covers the specific metrics that matter for guerrilla marketing ROI, how to set them up before the campaign, and how to interpret and present the results in a way that justifies continued investment in street-level programming.
The Measurement Problem and Why It Is Solvable
Guerrilla marketing’s measurement challenges stem from its physical nature. Unlike digital advertising, it does not generate automatic server-side logs. There are no default dashboards, no automatic impression counters, and no built-in attribution tools. Measurement must be designed and implemented intentionally.
Why “Unmeasurable” Is an Agency Failure, Not a Format Failure
When a guerrilla marketing campaign cannot be measured, the problem is almost always that measurement was not built into the campaign plan. An agency that sends out brand ambassadors without interaction logging, runs a poster campaign without QR tracking, and reports back with only a rough estimate of “how many people saw it” is delivering an incomplete product. Professional guerrilla marketing includes measurement as a standard component of the campaign, not an afterthought.
Building Attribution Infrastructure Before Day One
Attribution for guerrilla marketing requires decisions made before the campaign launches: unique promotional codes for each campaign element, QR codes with UTM parameters, consumer interaction logging protocols, and post-campaign survey plans if primary conversion tracking is limited. Setting up these systems after a campaign has launched means missing the first and often highest-volume data window.
Impression Metrics: What They Measure and How They Are Calculated
Impressions are the broadest metric for guerrilla marketing campaigns and the one most directly comparable to digital advertising CPMs. They measure how many times the brand’s message was potentially seen by a member of the public.
Foot Traffic-Based Impression Estimates
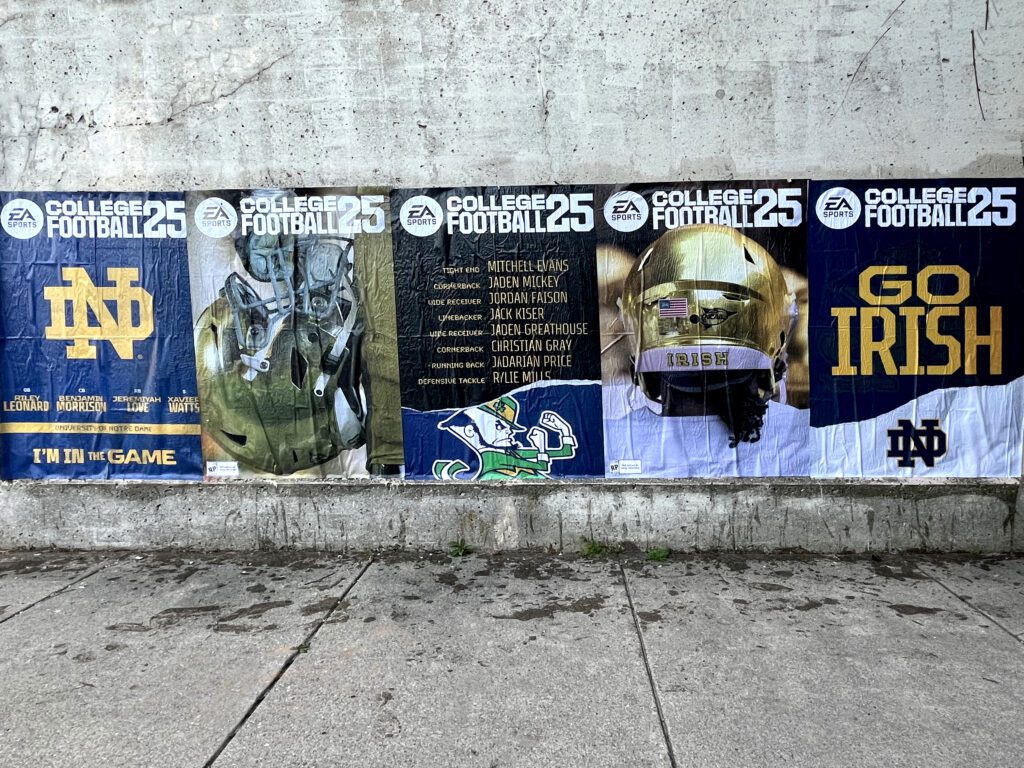
For wheatpaste poster campaigns, impression estimates use documented foot traffic data for each poster location, multiplied by the number of days the poster is visible. Our team uses city pedestrian count data, subway ridership figures, and property-specific foot traffic data to generate location-level impression estimates that are documentable and auditable.
LED Truck Impression Counts
For LED billboard truck campaigns, impressions are calculated using GPS route data and pedestrian and vehicle traffic counts along the truck’s route. GPS-stamped location records allow post-campaign impression reconciliation against actual route coverage rather than a theoretical estimate. Our trucks run GPS tracking throughout every campaign day.
Street Team Interaction Counts
For street team campaigns, direct interactions (materials handed, samples distributed, conversations logged) provide a conservative floor for impression counts. Total impressions from a street team position also include passerby who noticed the branded presence without stopping, estimated from foot traffic data for the location and time window.
Consumer Interaction Metrics: The Layer Below Impressions
Consumer interaction metrics capture something more valuable than impressions: evidence that real people engaged meaningfully with the brand campaign. These are the metrics that most directly connect to downstream conversion.
Direct Interactions and Samples Distributed
Every interaction between an ambassador and a consumer is logged: time, location, outcome (sample accepted, material taken, conversation completed, QR code scanned). At the end of each shift, these logs produce a precise count of direct interactions that can be compared across locations, days, and campaign phases to understand where the campaign performed best.
Conversation Quality Assessment
Beyond counts, shift leads log qualitative interaction data: consumer questions asked, positive and negative responses, product-specific feedback, and any consumer comments about the brand or product. This qualitative layer provides market research value in addition to campaign performance data. Brands often discover product feedback and messaging insights from field interaction logs that they would not have obtained through any other method.
Data Capture Rates
For campaigns with email opt-in, text-to-join, or survey components, the data capture rate (consumers who provide information divided by total interactions) is a key performance metric. Data capture rates above 25 to 30 percent of direct interactions are achievable with well-trained ambassadors and compelling offers. These captured consumers become a remarketing audience with demonstrated interest in the product.
Digital Attribution: Connecting Physical Campaigns to Online Behavior
Digital attribution methods bridge the physical campaign and online outcomes, providing the clearest possible line from street-level activation to measurable conversion.
QR Code Tracking
QR codes on campaign materials linked to tracked landing pages with unique UTM parameters provide direct attribution from the physical material to a specific online action. QR scan volume by location and date shows which campaign elements drove the most digital follow-through. Landing page conversion tracking shows what percentage of QR scanners completed a desired action (purchase, signup, reservation, coupon download).
Unique Promotional Codes
Unique promotional codes distributed during the campaign (different codes for different locations or days) enable direct sales attribution when codes are redeemed at checkout. Redemption timing, redemption location (online vs. in-store), and average order value from code redemptions provide a detailed picture of campaign-driven sales. This is the cleanest attribution method available for campaigns with an online or in-store purchase conversion path.
Geo-Fenced Retargeting
Running geo-fenced digital ads that target consumers who were physically present in the campaign activation zone creates a retargeting audience from campaign foot traffic. Conversion tracking from these retargeting ads, compared against a control audience not exposed to the campaign, provides an estimate of the incremental digital conversion driven by the physical activation.
Sales Lift Analysis: The Most Rigorous Attribution Method
Matched market analysis is the gold standard for guerrilla marketing ROI measurement. It compares sales or awareness metrics in markets where the campaign ran against comparable markets where it did not.
Test Market vs. Control Market Design
Before a campaign launches in multiple markets, designate specific markets as test markets (campaign active) and comparable markets as controls (no campaign). Post-campaign, compare sales, web traffic, brand search volume, or customer acquisition rates between test and control markets. The difference, adjusted for baseline differences between markets, represents the measurable lift attributable to the campaign.
In-Market Sales Data Integration
For CPG brands with retailer POS data access, post-campaign sales analysis in specific zip codes or neighborhoods where the campaign ran produces direct sales lift measurement. Geo-coded distribution data from the campaign, mapped against zip code-level sales data from the same period, enables direct correlation between campaign density and sales lift.
Brand Awareness and Search Volume Lift
For campaigns focused on brand awareness rather than direct response, branded search volume in campaign markets versus control markets provides a measurable proxy for awareness lift. Sustained increases in branded search during and after a campaign period, concentrated in geographic markets where the campaign ran, demonstrate brand recall driven by the street-level activation.
Post-Campaign Reporting: What a Professional Report Includes
A post-campaign report is the document that makes the case for continued investment and builds internal support for guerrilla marketing programs within a brand organization. A report that consists of a few photos and a rough impression number does not build that case. A report with documented metrics, photo documentation, interaction data, and attributed conversion data does.
Executive Summary and Key Metrics
Every campaign report opens with an executive summary: campaign dates, markets, formats, total investment, and the four or five top-line metrics that summarize performance. Decision makers who are not in the marketing day-to-day need to understand the campaign’s scale and performance in a single page.
Location-Level Performance Data
Below the executive summary, location-level data shows performance by individual activation point: foot traffic, interactions, materials distributed, and any digital attribution data available for that location. This level of granularity enables optimization decisions for future campaigns: which locations outperformed, which were underperforming, and why.
Photo and Documentation Appendix
A full photo appendix with timestamped, GPS-tagged photography from each location provides visual proof of campaign execution and quality. This documentation is essential for internal budget justification, retail partner reporting, and any future requests to demonstrate the campaign to stakeholders who were not present during execution. Our campaigns across guerrilla marketing services include full photo documentation as standard deliverable.
Setting Realistic ROI Expectations by Campaign Type
Not all guerrilla marketing formats deliver the same ROI profile, and not all campaign goals require the same metrics. Setting realistic expectations by format and goal prevents post-campaign disappointment and keeps measurement focused on the metrics that matter for each specific program.
Brand Awareness Campaigns
Primary metrics: impression volume, brand recall (measured via post-campaign survey), branded search lift in activated markets. Secondary metrics: social mentions, earned media, and consumer interaction quality. ROI benchmark: cost per thousand impressions compared to digital alternatives.
Direct Response and Trial Campaigns
Primary metrics: samples distributed, coupon redemption rate, QR scan volume, post-campaign purchase rate among captured consumer data. Secondary metrics: retailer sales lift in activated areas, new customer acquisition rate. ROI benchmark: cost per acquisition compared to paid digital acquisition costs in the same market.
Local Business Traffic Campaigns
Primary metrics: walk-in traffic increase (measured against pre-campaign baseline), promotional code redemptions, direct consumer attribution from front-of-house survey. Secondary metrics: reservation volume lift, repeat visit rate in the post-campaign period. ROI benchmark: revenue per cover change versus pre-campaign baseline. Our experiential marketing team builds these measurement structures into every campaign brief.
Frequently Asked Questions
Can guerrilla marketing ROI be measured accurately?
Yes, with proper measurement infrastructure built in before the campaign launches. Impression counts from documented foot traffic data, consumer interaction logs, QR code scan tracking, coupon redemption rates, and geo-coded sales lift analysis provide a multi-layer measurement picture. The precision depends on how thoroughly the attribution mechanics are built into the campaign plan.
What is a realistic CPM for guerrilla marketing campaigns?
Street-level guerrilla marketing typically delivers CPMs in the $2 to $12 range depending on format, location density, and campaign duration. High-traffic location campaigns (major transit hubs, street festivals) can deliver sub-$5 CPMs. This compares favorably with most digital display formats, and the physical impression quality is substantially higher.
How do you attribute sales to a guerrilla marketing campaign?
Attribution methods include unique promotional codes distributed during the campaign, QR codes with UTM tracking on campaign materials, matched market analysis comparing sales in activated markets versus control markets, geo-fenced digital ad retargeting with conversion tracking, and direct consumer survey attribution. Using two or three methods simultaneously provides the most defensible attribution.
What documentation should a guerrilla marketing agency provide for ROI reporting?
A professional agency should deliver GPS-stamped location records for all campaign activity, timestamped photography from each location, consumer interaction counts by location and date, samples or materials distributed, QR scan data, coupon redemption data (if applicable), and foot traffic estimates for each location based on documented pedestrian counts.
How long does it take to see ROI from guerrilla marketing?
Some impact is immediate: coupon redemptions, QR scans, and walk-in attribution can begin within hours of a campaign launch. Longer-term metrics like brand recall, search volume lift, and sales lift in activated markets typically show meaningful results within two to four weeks of a sustained campaign. Single-day activations at high-traffic events show faster immediate results than sustained neighborhood campaigns.
Is guerrilla marketing ROI better than digital advertising ROI?
For local and regional campaigns targeting specific geographic audiences, guerrilla marketing often outperforms digital advertising on a cost-per-meaningful-impression basis. The physical impression quality is higher, the targeting is geographic and precise, and there is no ad-blocking, bot traffic, or viewability uncertainty. The two formats are strongest when used together.