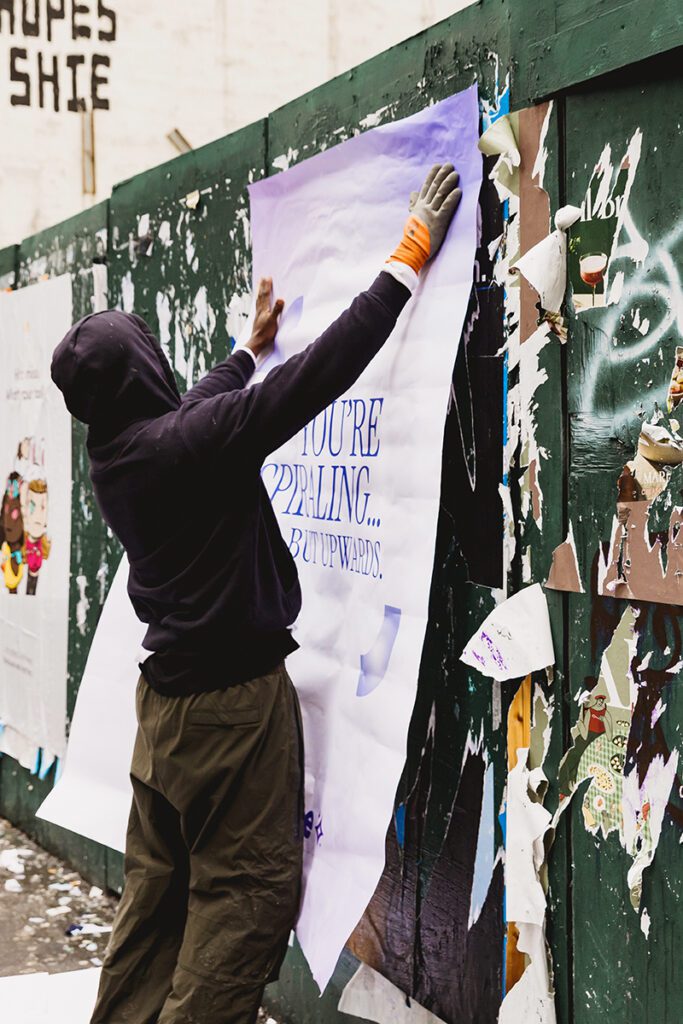
The most common complaint about street-level marketing is that you can’t measure it. We’ve heard that line from media buyers, brand managers, and CMOs who’ve never run a wheatpaste campaign before. It’s not true — but it requires a different measurement framework than a digital ad buy. City takeover wheatpaste campaigns generate real, trackable reach. The question is knowing what to measure, how to measure it, and how to set expectations before the campaign runs.
American Guerrilla Marketing field operators have been building and executing measurement frameworks for city takeover campaigns for over a decade. We’ve developed processes that give brands verifiable, specific data about what their campaign delivered — not estimates pulled from thin air, but GPS-tagged documentation, third-party foot traffic data, and organic social tracking combined into a post-campaign report that tells the complete story of a campaign’s reach.
This guide walks through how that measurement process works, what metrics actually matter, and how to interpret the numbers once you have them.
Why Measurement in Wheatpaste Campaigns Is Different
Digital ads measure clicks, conversions, impressions, and view-through rates in real time. A billboard buy measures Daily Effective Circulation (DEC) based on traffic counts. A TV spot measures GRPs against a demographic estimate. Each of these is its own measurement convention, and each has limitations that industry practitioners understand.
Wheatpaste city takeover campaigns work differently. The impressions are physical — they happen when a real person walks past a real wall. There’s no pixel to fire, no server log to query. What there is: documented placement locations, pedestrian traffic data for those locations, campaign duration estimates, and organic social signal. Put those together and you have a reach picture that’s actually more honest than many digital metrics, because it reflects real physical exposure, not algorithmic modeling.
The other thing that makes wheatpaste measurement distinctive: the organic social spillover can dwarf the physical impressions in terms of actual brand reach. A campaign that generates 300 organic Instagram posts from a single city takeover week might reach 100,000+ people through those posts alone — people who’ve never walked past a single poster. That digital reach layer is genuinely measurable and often undersold.
The Five Measurement Pillars
1. Verified Placement Count
The foundation of everything is knowing exactly what went up. American Guerrilla Marketing documents every placement with a GPS-tagged photo taken at time of installation. The GPS coordinates confirm the exact location; the timestamp confirms when it went up. This creates an unambiguous record of campaign execution that clients can review placement by placement.
Placement count by itself isn’t a reach metric — it’s an execution metric. But it’s the prerequisite for every subsequent measurement. If you don’t have verified placement documentation, every impression estimate is guesswork. Our guarantee to every city takeover client includes full GPS-tagged photo documentation delivered as part of the post-campaign report.
2. Pedestrian Impression Estimates
Once you have verified placement locations, the next step is estimating pedestrian impressions. This is where third-party foot traffic data comes in. Several platforms aggregate cell phone location data and pedestrian sensor data to generate estimates of how many people pass a given point per day. We use these data sources to build per-placement impression estimates based on each surface’s specific location.
The calculation is straightforward: average daily pedestrians per location × campaign duration in days = total estimated pedestrian impressions per placement. Sum across all placements and you have a total campaign pedestrian impression estimate.
How reliable are these estimates? Better than most people expect for high-density urban markets — Williamsburg, SoHo, Silver Lake, Wicker Park. These are neighborhoods with significant pedestrian data density, which means the foot traffic estimates are reasonably precise. In lower-density or more residential areas, the estimates carry more uncertainty and should be treated as directional rather than exact.
A typical city takeover wheatpaste campaign in New York — 40 placements across Williamsburg, LES, SoHo, and Bushwick, 14-day average campaign life — generates a conservative pedestrian impression estimate of 800,000 to 1.2 million. In an LA market with similar placement density across Silver Lake, Fairfax, and Echo Park, the range is somewhat lower due to pedestrian density differences but still typically clears 400,000.
3. Organic Social Media Monitoring
Organic social coverage is one of the most valuable — and most undertracked — outputs of a city takeover wheatpaste campaign. When a campaign achieves true corridor saturation, people photograph it. They post the photos. Their followers see the campaign without ever walking past a poster. This social multiplier can represent a significant fraction of total campaign reach, and it’s entirely trackable.
The most effective way to monitor organic social coverage is a combination of branded hashtag tracking and location-based social search. Brands running city takeover campaigns should set up monitoring for:
- Campaign-specific hashtags (if used in poster design)
- Brand name + city mentions during the campaign window
- Location tags at or near key placement neighborhoods
- Instagram and TikTok location searches for the neighborhoods you’ve saturated
From our case studies: campaigns that achieve true corridor dominance in a high-photo neighborhood like Williamsburg or Venice routinely generate 100-400 organic posts in the first week. Each of those posts reaches the poster’s followers — typically a few hundred to a few thousand people. At the low end, that’s 30,000-40,000 additional organic impressions. At the high end, when a high-follower account picks up the campaign and posts it, that single post can reach hundreds of thousands of people.
We’ve run campaigns where a single organic post from a mid-tier influencer (250,000 followers) generated more measurable brand impressions than all the physical placements combined. That’s not a reason to under-invest in physical placements — the physical placements are what triggered the post — but it illustrates why organic social is a critical measurement pillar, not an afterthought.
4. Campaign Longevity Tracking
Wheatpaste campaigns don’t disappear the day after installation. A well-pasted campaign on a quality permissioned surface can remain visible and legible for 2-6 weeks, depending on weather, surface type, and competing paste activity in the area. That extended life is part of the reach story.
Longevity tracking means checking placements at intervals after the initial install — typically at the 1-week, 2-week, and 4-week marks — to document which placements are still active and in what condition. This information feeds into the cumulative impression estimate: a placement that’s still clean and visible at week 3 has generated three times the impressions of one that got covered or damaged in week 1.
Our field operators perform longevity checks on major city takeover campaigns as standard. The data informs both current-campaign measurement and future campaign planning — it tells us which surfaces in which neighborhoods have the best longevity, which factors into surface selection for subsequent campaigns.
5. Correlation with Brand Metrics
The highest level of measurement is correlating the city takeover campaign with broader brand performance metrics — website traffic spikes, direct search volume changes, app download bumps, social follower growth. This kind of correlation analysis requires setting measurement windows before the campaign runs so you have clean pre-campaign baselines.
Not every client has the analytics infrastructure to do this rigorously, but for brands that do, the correlation data can be striking. We’ve seen campaigns where a city takeover week in New York produced a measurable spike in branded search volume, a bump in Instagram follower growth, and a direct traffic increase to the brand’s website — all in the same 72-hour window. That kind of convergent evidence is about as close to campaign attribution as you get in out-of-home advertising.
Building Your Pre-Campaign Measurement Setup
Good post-campaign measurement starts before the campaign runs. Here’s what to set up in advance:
Establish Clean Baselines
Pull 30-60 days of pre-campaign data for the metrics you care about: website traffic from the campaign cities, branded search volume, social follower growth rate, direct app installs if applicable. These baselines are what you’ll compare post-campaign numbers against. Without them, any post-campaign movement is noise.
Set Up Social Monitoring
Configure keyword and hashtag monitoring before the campaign launches. Tools like Sprout Social, Mention, or even native Instagram location search work for this. If the campaign has a specific hashtag, build it into the poster design. If not, monitor brand name + city combinations and location tags in the target neighborhoods.
Define the Measurement Window
Be specific about when your measurement period starts and ends. For a city takeover that launches on a Monday, a reasonable measurement window might be Monday through the following Sunday for social tracking, and Monday through 30 days out for impression tracking. Defining this in advance prevents post-hoc cherry-picking of favorable windows.
Align on What Counts as Success
Before the campaign runs, agree with your team on what success looks like. Is it a minimum impression threshold? A specific number of organic posts? A measurable website traffic bump? Brands that define success criteria before the campaign launches end up with much cleaner post-campaign evaluations than brands that try to figure out what success means after seeing the numbers.
| Measurement Pillar |
What It Measures |
Data Source |
Reliability |
| Verified Placements |
Execution confirmation |
GPS-tagged photos |
High |
| Pedestrian Impressions |
Physical exposure estimate |
Foot traffic data + duration |
Medium-High |
| Organic Social Coverage |
Digital reach spillover |
Social monitoring tools |
High (for direct posts) |
| Campaign Longevity |
Extended impression accumulation |
Field checks at intervals |
High |
| Brand Metric Correlation |
Campaign-driven behavior change |
Analytics platforms |
Medium (correlation only) |
What the Numbers Actually Look Like
Brands running their first city takeover wheatpaste campaign often ask what to expect from the numbers. Here’s a realistic picture based on what we’ve documented across hundreds of campaigns in our nationwide portfolio:
A mid-scale city takeover in New York — covering Williamsburg, LES, and Bushwick with 30-40 placements over a single operational window — typically generates:
- Conservative pedestrian impression estimate: 600,000-1 million over a 14-day campaign life
- Organic social posts: 100-250 in the first 7 days for a well-designed campaign in photo-friendly neighborhoods
- Estimated organic social reach: 150,000-500,000 depending on the follower size of accounts that post
- Campaign longevity: most placements remain legible for 2-3 weeks, with some lasting 4+ weeks
An LA city takeover hitting Silver Lake, Echo Park, and Fairfax with similar placement count:
- Pedestrian impressions: 350,000-700,000 (lower pedestrian density than NYC)
- Organic social posts: 80-200 (strong photo culture in these neighborhoods)
- Campaign longevity: typically 3-5 weeks (lower humidity and less rain than New York extends poster life significantly)
Chicago running Wicker Park, Logan Square, and Pilsen:
- Pedestrian impressions: 400,000-800,000 (highly walkable core neighborhoods)
- Organic social posts: 70-150
- Campaign longevity: seasonal variation — summer campaigns last longer than winter
The Honest Conversation About Attribution
Any measurement framework for out-of-home advertising — wheatpaste, billboards, transit ads, anything — has to be honest about the limits of attribution. Physical impressions don’t come with a conversion pixel. You can estimate reach; you can track correlation with downstream metrics; you can collect organic social data. But you can’t draw a direct causal line from a poster on Bedford Avenue to a specific purchase decision the way you can with a Google Shopping ad.
That’s not a flaw — it’s a feature of how brand-level advertising actually works. Awareness-building doesn’t convert in a straight line. It accumulates. A consumer who walks past your campaign every day for two weeks has a fundamentally different relationship with your brand than someone who clicked an ad once. The measurement challenge is that accumulated familiarity is hard to quantify.
What we’ve found from firsthand experience running city takeover campaigns alongside brands’ other marketing activity: the campaigns that generate the most measurable downstream lift are ones where the physical campaign is part of a multi-channel moment. The wheatpaste goes up in Williamsburg the same week a paid social campaign is running in New York. The two reinforce each other. Someone sees the poster on the street, then sees the social ad the next day, and the combination creates brand recognition that neither would generate alone. Measurement in that context requires looking at the whole media mix, not just the street-level component.
Post-Campaign Reporting: What AGM Delivers
After every city takeover campaign, AGM delivers a post-campaign report that includes:
- Full placement map with GPS coordinates for every surface hit
- Timestamped installation photos for each placement
- Neighborhood coverage summary (which areas, how many placements per area)
- Pedestrian impression estimates by location and neighborhood
- Longevity check data at agreed intervals
- Organic social monitoring summary (if social tracking was scoped into the campaign)
This is a professional-grade documentation package. It gives brands real data they can use for internal reporting, campaign planning, and media mix decisions. It’s also a record that holds us accountable — if something didn’t go up as planned, that’s in the report. We don’t hide misses. We document everything, including any placements that were unavailable due to surface conditions or competing campaigns, and how they were replaced.
That level of transparency is part of what we mean when we talk about being certified and licensed operators. It’s not just legal compliance — it’s professional accountability. When we tell a brand their campaign reached X neighborhoods and Y million pedestrians over Z days, that’s a statement backed by firsthand documentation, not an estimate manufactured to justify the invoice.
Frequently Asked Questions
How do you measure impressions from a wheatpaste city takeover campaign?
Impressions are estimated using pedestrian foot traffic data for each placement location, multiplied by the number of days the campaign remains active. American Guerrilla Marketing uses GPS-tagged placement records combined with third-party foot traffic datasets to build impression estimates for every campaign. The result is a placement-by-placement breakdown of estimated exposure, summed to a total campaign reach number.
What proof of placement does AGM provide for city takeover campaigns?
Every placement American Guerrilla Marketing executes is GPS-tagged and documented with a timestamped photo. Post-campaign reports include a full placement map, photo documentation for each surface, installation timestamps, and neighborhood coverage summaries. This is a standard deliverable on every city takeover campaign, not an add-on.
Can social media mentions be tracked as part of campaign reach?
Yes. Organic social media posts featuring your campaign are a trackable component of total reach. Brands can set up keyword and location monitoring before the campaign launches to capture UGC throughout the campaign window. In our experience with high-saturation city takeover campaigns, organic social posts can represent as much as 30-50% of total estimated reach — sometimes more when high-follower accounts share the campaign.
How long does a city takeover wheatpaste campaign typically stay up?
Wheatpaste campaigns typically remain visible for 2-4 weeks depending on weather conditions, surface type, and competing campaign activity in the area. Los Angeles campaigns tend to last longer due to lower rainfall. New York campaigns in high-paste-activity neighborhoods may see more coverage competition. AGM factors expected longevity into impression estimates to provide an accurate full-run reach number.
Does AGM guarantee placement documentation on city takeover campaigns?
Yes. American Guerrilla Marketing provides GPS-tagged photo documentation for every placement as a standard deliverable on every city takeover campaign. This is part of our operating standard — you know exactly what went up, where, and when, with no ambiguity. If a planned placement was unavailable for any reason, that’s documented in the report along with the replacement surface used.