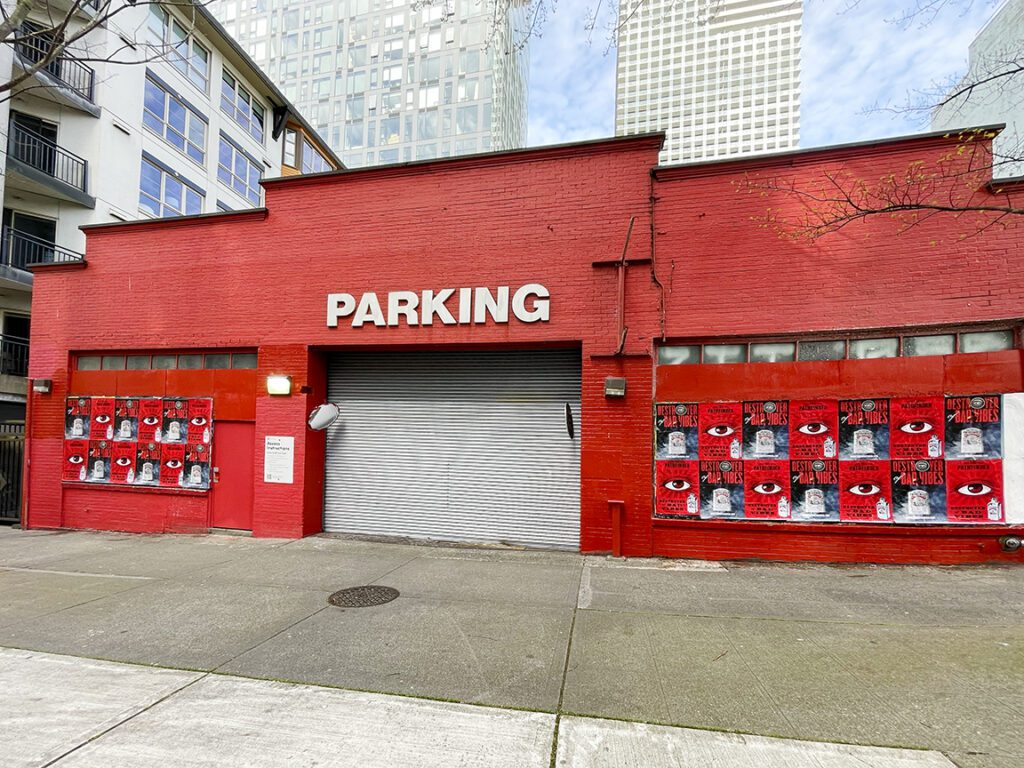
This question comes up in almost every city takeover conversation we have with clients. How many posters? Give me a number. The honest answer is: it depends. But that’s not the answer anyone wants, so let’s go deeper. What it depends on — the market size, the neighborhoods, the target audience’s density, the surface quality, the format mix — can all be quantified. And from that, real numbers emerge.
American Guerrilla Marketing field operators have placed campaigns in every major media market in the country over the course of a decade. We’ve run campaigns with 100 placements that felt like a takeover and campaigns with 500 placements that got lost in the noise. Volume is a factor. Distribution is the bigger factor. And format matters more than most clients expect.
This article breaks down the actual poster counts that generate a genuine dominance effect in different types of markets, and explains the variables that push those numbers up or down.
Why There’s No Single Universal Number
Before getting into specific numbers, it’s worth understanding why there’s no single answer that applies to every city.
New York has 8.3 million people in five boroughs. A campaign targeting 22-to-30-year-old music fans in Brooklyn and lower Manhattan is competing for attention against ten thousand other visual stimuli per block. The threshold for standing out in that environment is different from what it takes to stand out in a mid-size market like Denver or New Orleans.
Surface quality creates another variable. 50 placements on high-quality, high-visibility anchor walls in premium locations can generate more visual impact than 200 placements on marginal surfaces in low-traffic areas. Counting posters without accounting for surface quality gives a misleading picture of actual campaign coverage.
And the target audience’s geographic concentration matters. A niche audience concentrated in two or three neighborhoods requires fewer total placements to reach saturation than a broad audience spread across a dozen neighborhoods. Dense targeting means fewer posters. Broad targeting means more.
That said, the numbers we’ve developed from firsthand campaign experience provide a reliable starting framework.
The Saturation Threshold: The Number That Actually Matters
More important than total poster count is the saturation threshold — the number of placements per neighborhood that triggers the psychological effect of ubiquity. From our experience running campaigns across our nationwide portfolio, this threshold sits at approximately 15 to 25 placements per neighborhood for standard-format posters in a major market.
Below 15 placements per neighborhood, a person moving through the area is likely to encounter the campaign once or not at all. Above 25 placements in a contained neighborhood, the campaign starts to feel like wallpaper. The sweet spot is persistent visibility without overwhelming density.
This 15-to-25 range applies to a single neighborhood with defined pedestrian corridors. In larger neighborhoods with more geographic spread — like Chicago’s Pilsen or Brooklyn’s Bed-Stuy — the upper end of the range needs to expand to maintain density. In tighter, smaller neighborhoods, the lower end may be sufficient.
Field reference: In Williamsburg, Brooklyn — a neighborhood with roughly 12 blocks of high-density commercial streetscape — we’ve found that 22 to 30 placements creates genuine saturation. Below 18, the campaign is present but not dominant. Above 35, you’re overlapping your own coverage without adding reach.
Market Size Benchmarks
Using the saturation threshold as the baseline, here’s how total campaign size scales by market:
Major Markets (New York, Los Angeles, Chicago)
A full city takeover in a major media market covering 10 to 15 neighborhoods requires:
- Minimum effective count: 200 to 250 placements
- Full saturation: 350 to 500 placements
- Maximum density campaign: 600 to 1,000+ placements
The minimum effective count creates a genuine multi-neighborhood presence but doesn’t fully blanket the market. Full saturation covers the priority neighborhoods thoroughly and extends reach into secondary zones. Maximum density campaigns are used for major launches — album drops, film releases, platform launches — where the brand is explicitly trying to create an inescapable street presence.
Mid-Size Markets (Atlanta, Miami, Seattle, Denver, Austin)
Mid-size markets have smaller geographic footprints for their target audiences, so saturation is achievable at lower total volumes:
- Minimum effective count: 100 to 150 placements
- Full saturation: 200 to 300 placements
- Maximum density campaign: 350 to 500 placements
The mistake in mid-size markets is applying New York-scale thinking to a city that achieves saturation at a fraction of that volume. We’ve run campaigns in cities like Nashville and Portland where 150 placements, intelligently distributed, produced stronger saturation effects than twice that many in a market the client defined too broadly.
Small Markets and Secondary Cities
For markets like Raleigh, Richmond, Louisville, or Albuquerque, the numbers compress significantly:
- Minimum effective count: 60 to 80 placements
- Full saturation: 100 to 150 placements
- Maximum density campaign: 200 to 250 placements
Small markets are often undervalued in campaign planning because clients assume the volume has to match what they’ve seen in New York or LA. It doesn’t. A 120-placement campaign in a secondary city can produce a stronger market presence than a 400-placement campaign in New York, purely because the competition for surface space and visual attention is lower.
How Format Mix Affects Your Real Coverage
Total poster count is only one dimension of campaign coverage. Format mix — the distribution of sizes across the campaign — determines how many visual impressions those posters actually generate.
| Format |
Typical Size |
Visual Impact Factor |
Best Use |
| Standard |
24″ x 36″ |
1x |
Dense street-level coverage |
| Large Format |
48″ x 70″ |
2.5x |
Anchor walls, major intersections |
| Extra Large |
56″ x 84″ or bigger |
4x |
Signature walls, destination locations |
| Mini (Street Level) |
11″ x 17″ |
0.5x |
Supplemental density, small surfaces |
A campaign of 200 posters that includes 15 extra-large anchor placements is visually more dominant than 250 standard-format posters with no anchor placements. Our field operators plan the format mix based on the surface inventory in each neighborhood — anchor walls get the large formats, street-level coverage fills in with standard and large, and small surfaces get supplemental mini formats.
The Anchor Wall Principle
Every great city takeover campaign has anchor walls — surfaces so prominent and well-placed that they anchor the entire campaign’s visual identity in a neighborhood. These are the surfaces that get photographed, shared on social media, and referenced in press coverage. Typically 3 to 5 anchor placements per neighborhood is the right ratio for a full-coverage campaign.
When we plan a city takeover in New York, we identify the anchor walls first, often before the neighborhood’s full surface inventory is finalized. The anchor walls define the campaign’s visual landmarks; everything else fills in around them. This is the firsthand planning intelligence that comes from having walked every major neighborhood in the market over a decade of campaigns.
The Distribution Problem: Why Concentration Undermines Dominance
The most common mistake in high-volume campaigns is concentration. A client wants 400 posters and naturally gravitates toward putting the highest density in the neighborhood they know best or care most about. The result is a campaign that’s overwhelming in one zone and invisible everywhere else.
True city dominance comes from cross-neighborhood presence. The human brain builds the “this brand is everywhere” perception from encounter frequency across different contexts, not from seeing the same poster repeatedly on the same block. Ten encounters in five different neighborhoods is psychologically more powerful than twenty encounters on the same block.
This is why our planning process starts with geographic distribution rather than volume. We determine how many neighborhoods the target audience covers, assign saturation thresholds to each based on size and priority, and derive the total poster count from those targets — rather than starting with a round number and distributing it arbitrarily.
“We walked through the planning process with a music client who wanted to do 300 posters in Williamsburg alone. We redistributed that same budget to 18 placements each across 15 Brooklyn and Manhattan neighborhoods. Same overall count. Dramatically different market impact.”
Accounting for Attrition
Campaign planning needs to account for attrition — the natural loss of placements over the campaign’s run due to weather, competing posters, and surface changes. For a 2-to-4-week campaign, expect 15 to 25% attrition on standard surfaces. Premium permitted surfaces hold better and typically see 10 to 15% attrition over the same period.
Attrition has two implications for campaign sizing:
- Order buffer: Print and deploy 10 to 15% more posters than your target coverage count
- Refresh planning: For campaigns targeting a full month of presence, schedule a mid-campaign refresh deployment to replace attrition and maintain coverage density
A campaign that opens with 300 placements and loses 60 to 75 over two weeks has 225 to 240 active placements at the campaign’s midpoint. If that’s still above the saturation threshold for the covered neighborhoods, no refresh is needed. If it drops below threshold in key neighborhoods, a targeted refresh keeps the campaign at full effectiveness.
Multi-Format Strategy for Maximum Dominance
The most effective city takeover campaigns we run use a layered format strategy that creates presence at multiple visual scales:
Layer 1: Anchor Presence
2 to 4 extra-large or large-format placements per neighborhood on the highest-visibility surfaces. These are the landmarks. They get photographed. They create the “this is a real campaign” signal that makes the brand feel established.
Layer 2: Street Density
12 to 20 standard or large-format placements per neighborhood distributed across commercial corridors, transit-adjacent surfaces, and residential blocks. These are the volume drivers. They create the frequency of encounter that makes the campaign feel ubiquitous.
Layer 3: Micro Presence
8 to 12 small-format placements in tight spots — utility poles, small building alcoves, stairwell entries. These aren’t the visual anchors. They’re the details that make a campaign feel thorough to the eagle-eyed observer who’s already been primed by the larger placements.
Together, these three layers create a campaign that works at every scale of visual attention — from the person glancing across a street to the person who stops and looks at every wall they pass. The total count across all three layers for a single neighborhood in a major market runs 22 to 40 placements. Across 10 to 15 neighborhoods, that’s a campaign of 220 to 600 total placements — consistent with the market-size benchmarks above.
When More Isn’t More
There’s a ceiling on effective poster density. Beyond a certain point, additional placements in the same zone stop adding impact and start creating clutter. When a wall has posters from three different campaigns overlapping each other, none of them is doing its job effectively.
The way to avoid this is through surface discipline. Our field operators know the surface capacity of each neighborhood in our markets. We don’t push placements into saturated areas just to hit a round number. The target is the right number in the right places — not the maximum number everywhere.
A city takeover campaign built on 300 well-placed, well-documented, permissioned placements across 12 neighborhoods will consistently outperform a 600-placement campaign that concentrated heavily in 3 neighborhoods and scattered thinly through the rest. The difference is planning. And planning is where a decade of firsthand campaign experience shows its value.
Frequently Asked Questions
How many posters does a city takeover wheatpaste campaign typically require?
A genuine city takeover in a major market like New York or Los Angeles typically requires 300 to 600 poster placements across 10 to 15 neighborhoods. Smaller markets like Austin or Nashville can achieve saturation with 150 to 250 placements. The number that matters is density per neighborhood, not just the total count.
Is there a minimum number of posters for a campaign to feel like a takeover?
Yes. Based on our experience running campaigns across every major media market, the minimum threshold for a genuine saturation effect is approximately 15 to 20 placements per neighborhood, across at least 6 to 8 neighborhoods. Below that threshold, you have a campaign. Above it, you have a takeover.
Does size matter when counting wheatpaste poster placements?
Yes. A single large-format poster — 48×70 or bigger — on an anchor wall can generate the visual impact of 3 to 4 standard-format placements. We factor format mix into campaign planning so the total coverage count reflects actual visual impact, not just raw poster numbers.
How do you avoid over-saturating a neighborhood?
Over-saturation in a single neighborhood creates visual clutter and actually reduces impact. AGM field operators set a maximum density ceiling per neighborhood based on available permitted surfaces and pedestrian traffic volume, then redistribute additional placements to adjacent neighborhoods to expand geographic reach.
Can you refresh posters mid-campaign to maintain coverage?
Yes. AGM builds refresh cycles into campaigns that need to maintain presence for more than 2 to 3 weeks. A refresh deployment replaces weathered or over-posted placements and can expand coverage into additional neighborhoods if the campaign is performing well.