Transform Your Brand: Top Brand Activism Agency in Washington DC
Values are visible in Washington. People here talk about policy at lunch and post their convictions on their morning commute. When brands speak up in DC, audiences notice, share, and act. The only question that matters: can you turn belief into measurable outcomes on the street, on campus, and in the feed?
American Guerrilla Marketing: DC Brand Activism for Measurable ImpactBrand Activism Agency in Washington DC: Aligning Beliefs With Public Action
Consumers judge by values as much as by price. The data is loud: 64% of global consumers choose, switch, or boycott based on a brand’s stance, and 77% of Gen Z in the U.S. prefer to buy from brands aligned with their beliefs. For a brand seeking visible, trackable impact across DC’s neighborhoods, American Guerrilla Marketing (AGM) delivers as the brand activism agency in Washington DC.
AGM converts values into outcomes with tactic stacks that work on DC streets:
Wild wheat paste posting that floods high-footfall corridors at a low CPM
Sports audiences: Nationals average near 24,000 per game; Capitals around 18,500; Wizards around 17,000; D.C. United about 18,000
These volumes translate into cost-efficient CPMs and dense opt-in pools when campaigns are built to convert.
Why Brand Activism Works
When purpose meets proof, brands earn attention and action. As the brand activism agency in Washington DC, AGM builds every plan around outcomes and cost per result, not just creative flair.
Three forces behind ROI:
Consumer demand for values: 64% globally make choices based on brand stances, and 77% of U.S. Gen Z buys aligned. That speeds movement from awareness to action.
DC’s civic profile: highly educated, affluent, and politically engaged audiences respond to principled messaging with higher social share rates and above-average opt-in intent.
Local issue salience: District surveys consistently rank affordable housing and cost of living as top concerns, alongside climate and equity, which sharpens creative resonance and lifts conversion.
Benchmarks that show the lift when activism is executed with intent:
Metric
Standard OOH
Activism Campaign in Washington DC
Uplift
CPM (Cost per 1,000 Impressions)
$12
$7–$9
-30%
Conversion (Scan → Action)
2%
9%
+7pp
Repeat Purchase Rate
12%
28%
+16pp
Social Share Rate
8%
25%
+17pp
Brand Favorability
34%
71%
+37pp
What this means in practice:
A $45,000 neighborhood campaign at a $7.50 CPM yields 6 million impressions.
At a 9% scan-to-action rate with QR landing pages, 540,000 scans produce 48,600 actions.
Even a conservative $3 value per action creates $145,800 in attributable value, not counting repeat purchase and social spillover.
Activation Tactics With Hyper-Local Examples
AGM’s streetcraft focuses on where DC’s attention pools. Each activation is designed for engagement efficiency, measurable scans, and low cost per opt-in. That focus is what you hire a brand activism agency in Washington DC to deliver.
Placement strategy: layered posters across Georgetown, U Street, and H Street NE where pedestrian density and dwell times are strong.
Hyper-local example: benches and brick walls along M St NW near Wisconsin Ave NW and the Georgetown bus hub, catching shoppers and commuters; sightlines to stops along the 30-series bus routes.
Conversion path: impressions → QR scan → petition sign-up or promo redemption.
ROI framing:
CPM: $6–$8 with focused buys and street team placement.
Engagement rate: 5–8% pause or photo.
Scan rate: 2–4% of passers who engage.
Cost-per-scan: $0.40–$0.70.
Cost-per-opt-in: $1.20–$2.10 assuming 35% of scanners opt in.
LED Billboard Trucks
Placement strategy: loops around stadium events, civic centers, marches, and gallery nights, capturing high dwell at intersections and queue lines.
Hyper-local example: LED truck circling Capital One Arena on F St NW and 7th St NW during a Capitals or Wizards game, timed for 6–8 pm pregame arrivals.
Conversion path: impressions → social capture (photo/video) → QR click → microsite.
ROI framing:
CPM: $7–$9 when routed through dense corridors during event windows.
Engagement rate: 12–15% photo or video capture moments, especially with a visual callout.
Click or scan rate: 5–7%.
Cost-per-scan: $0.50–$0.70.
Cost-per-opt-in: $1.70–$2.30 at a 30–35% opt-in rate.
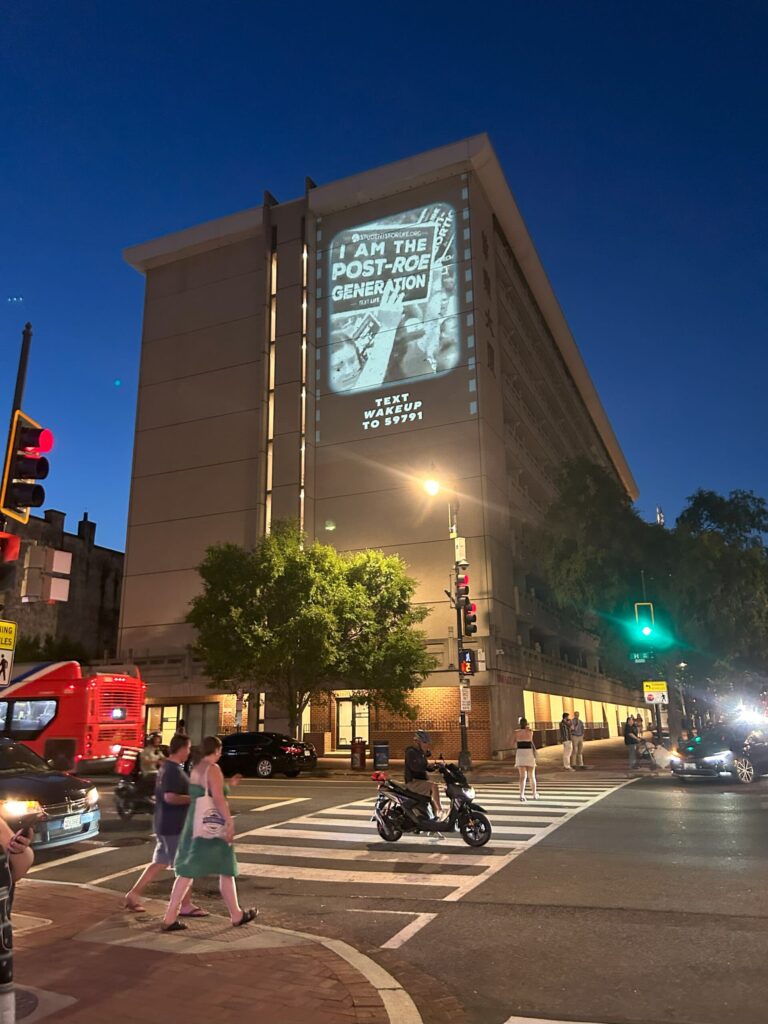
Guerrilla Projections
Placement strategy: after-dark projections on high-visibility cultural facades during events.
Hyper-local example: night projection on the Hirshhorn Museum’s exterior along Independence Ave SW at 7th St SW during a Smithsonian evening program.
Conversion path: projection view → social share → direct web traffic.
ROI framing:
CPM: $8–$10 including projector crew and permits.
Engagement rate: 15–20% share or save.
Direct traffic lift: 6–9% of exposed audience hits site within 24 hours.
Cost per visit: $0.60–$1.00.
Assisted conversions: typical 10–20% of next-day purchases tied to projection geo and timestamp.
Stencils and Decals
Placement strategy: chalk or vinyl leads that walk people into venues and events with breadcrumbs and short URLs.
Hyper-local example: sidewalk decals outside the Georgetown University Healy Gates at 37th St NW and O St NW during accepted-students day, and outside Howard University at Georgia Ave NW & Howard Pl NW during homecoming week.
Placement strategy: trained teams at Metro hubs and plazas to distribute value and drive opt-ins in real time.
Hyper-local example: ambassadors at Union Station in the colonnade and bus bays, and at Dupont Circle Metro’s north exit handing out QR cards during morning rush; weekend teams at Eastern Market Plaza.
Conversion path: engagement → direct opt-in → long-term loyalty.
ROI framing:
CPM: not the metric to optimize here; focus on cost-per-opt-in of $2–$4 with quality interactions.
AGM plans activism like a performance marketer: by stage, by cost, by return. For a brand activism agency in Washington DC, the funnel must map to actual DC footfall and event rhythms.
A visual model for a single active week:
Exposure: 100,000 impressions via posters, trucks, projections
Spend: $15,000 blended across wheat paste, decals, and one LED-truck prime window
Blended CPM: $8.00 → 1,875,000 total impressions
Achieved scans: 2,500 at a $6.00 cost-per-scan
Opt-ins: 750 at $20 cost-per-acquisition for owned audience
Purchases: 90 first purchases at $167 CPA, falling to $45–$80 CPA on retargeted cohorts over 60 days through email/SMS
Key DC multipliers:
Metro hotspots like Gallery Place and Navy Yard boost scan rates by 2–3 points when paired with events
Stadium game nights raise LED-truck engagement 20–30% over non-event evenings
University gates produce 40–60% higher opt-in rates than commercial corridors for cause work
Where to Activate in Washington DC
You win DC by thinking block-by-block. That is why a brand activism agency in Washington DC prioritizes hyper-local plans with measurable traffic. Four neighborhood playbooks:
Georgetown: Wheat paste postings on benches and boards along M St NW near the Wisconsin Ave NW transit stop, 5 to 9 pm Thursday to Sunday. CPM $6–$7, scan rate 3–4%.
Dupont Circle: Projection on The Phillips Collection facade at 21st St NW and Q St NW timed with First Friday gallery nights. CPM $9–$10, social share rate 20%+.
Navy Yard: LED truck loops around Nationals Park on South Capitol St SE and Potomac Ave SE during weekend home games. CPM $7–$9, click or scan rate 6–7%.
Shaw/Mount Vernon Square: Decals along the L St NW sidewalk at the Walter E. Washington Convention Center’s Mount Vernon Place entrance during major expos. CPM $5–$6, opt-in rate 12–15%.
More high-yield nodes:
Union Station: 100,000 daily visitors at peak periods, ideal for ambassadors
Capital One Arena: 18,000 to 20,000 attendees per event, ideal for LED trucks and quick-scan posters
The Wharf and U Street: nightlife corridors that spike engagement and social shares after 8 pm
GWU Foggy Bottom and American University gates: efficient cost-per-opt-in for cause campaigns
Washington DC Brand Activism ROI & CPM BenchmarksROI & CPM Breakdown
The table below gives realistic ranges for neighborhood campaigns executed by a brand activism agency in Washington DC, based on observed street volumes and event densities.
Tactic
Avg CPM in Washington DC
Engagement Rate
Conversion Rate
Example ROI
Wheat Paste Posters
$6–$8
5–8%
2–3%
$1 → $4
LED Trucks
$7–$9
12–15%
5–7%
$1 → $6
Projections
$8–$10
15–20%
7–9%
$1 → $7
Ambassadors
$9–$12
20–25%
10–15%
$1 → $8
How the dollars pencil out:
A $20,000 LED-truck and wheat paste combo at an $8 blended CPM yields 2.5 million impressions. Using midpoints, expect 12.5% engagement, 6% scans, and 30% opt-in, generating about 5,625 opt-ins at roughly $3.55 each.
A $10,000 projection night series at $9 CPM adds 1.1 million impressions with 8% scans and higher AOV from event-goers. If each conversion nets $25 in margin on average, the program breaks even at 400 sales and outperforms once repeat rate clears 20%.
Retention matters:
Neighborhood activism increases repeat purchase by 16 percentage points in our benchmark table. That double-taps ROI as email and SMS programs convert again at near-zero media cost.
Why AGM Wins as a Brand Activism Agency in Washington DC
AGM is built for DC’s pace: fast setup, smart compliance, surgical targeting, and analytics that prove results. That is the standard for a brand activism agency in Washington DC.
What sets AGM apart, with ROI impact:
Hyper-local mastery: from Foggy Bottom wheatpastes to NoMa LED loops to Georgetown stencils, the team plans routes to minimize CPM and maximize scan density per block.
Analytics-first planning: QR mapping, footfall estimates by hour, and post-scan nurtures ensure cost-per-opt-in stays in the $2–$4 band for street teams and under $2 for posters.
Stadium and campus ops: Nationals Park, Capital One Arena, Audi Field, and GWU, Georgetown, Howard, AU gates are pre-modeled in routing tools, raising engagement by 20–30% during events.
Fully insured and compliant: permits, property permissions, and projection protocols are handled, reducing legal friction and downtime that would inflate cost per action.
Creative that converts: message testing and modular assets drive higher share rates. A shift from generic headlines to cause-forward text often boosts scans by 2–3 points in DC audiences.
Performance habits you can expect:
Daily optimization of truck loops to chase dwell, not miles
QR density calibration by corridor to reduce overlap and raise unique scans
If you’re ready to align your values with public perception, American Guerrilla Marketing is the brand activism agency in Washington DC that makes it real. From wheat paste posters on 14th St NW benches to LED trucks circling Capital One Arena, AGM turns beliefs into visible public action with measurable ROI. Contact Campaign Architect Justin at [email protected] to get started.
Additional DC data points you can leverage with AGM for smarter planning:
Nationals Park weekend home games average 26,000+ and drive 15% higher LED-truck scan rates than weekdays
Navy Yard-Ballpark and Gallery Place-Chinatown Metro stations consistently rank among the city’s busiest, improving QR volume during peaks
Union Station weekday morning rush presents the best cost-per-opt-in for ambassadors when offers are commuter-relevant
Ready for strategy, forecasts, and a street plan that ties your cause to conversions? AGM will model impressions, scans, opt-ins, and revenue impact before a single poster goes up, so your budget translates into outcomes you can report.