Dominating Brand Activism in Rhode Island: Engage & Inspire
Rhode Island’s residents reward brands that show up for the community. They want to see values in motion, not just in a press release. That is the moment where street-level creativity and hard metrics finally meet.
Rhode Island Brand Activism: Turning Values into Public ImpactBrand Activism Agency in Rhode Island: Aligning Beliefs With Public Action
Consumers judge brands by what they do, not just what they say. In Rhode Island, where local culture, campuses, and neighborhood pride drive conversation, public-facing action turns values into momentum. American Guerrilla Marketing (AGM) operates as the brand activism agency in Rhode Island that translates beliefs into visible, measured outcomes across posters, LED billboard trucks, guerrilla projections, stencils, decals, and high-touch ambassador teams.
This approach is built for scrutiny. Each activation ties to data: impressions, scans, opt-ins, purchases, repeat rates, and social shares. It’s also built for Rhode Island’s footprint. Providence sits near 195,000 people, with daily I‑95 volumes topping 150,000 vehicles, RIPTA delivering roughly 10.5 million annual rides and 30,000 to 40,000 weekday boardings, and hub stations like Kennedy Plaza funneling thousands per day. Add sports audiences that gather at Amica Mutual Pavilion (Friars basketball near 10,000 per game) and Providence Bruins nights averaging around 8,000 fans, and you have a state primed for values-forward brand action that can be counted.
Why Brand Activism Works
Three forces amplify impact: clear values, public visibility, and measurable response. Global and U.S. trends are decisive. Research shows 64% of global consumers buy, switch, or boycott based on a brand’s stance. Among U.S. Gen Z, 77% prefer brands aligned with their beliefs. Locally, coastal resilience and housing affordability consistently rank among Rhode Islanders’ top concerns in public polling, giving brands a credible path to rally community support. That’s the lane for a brand activism agency in Rhode Island to turn beliefs into growth.
Campaign math reflects the upside:
RIPTA’s core routes, including the R‑Line, deliver dense repeat exposures for posters and street teams.
Amica Mutual Pavilion packs in 8,000 to 12,000 attendees on busy nights.
Providence Station and the new Pawtucket/Central Falls Transit Center layer in daily rail commuters for morning and evening visibility.
Table: Impact Uplift From Activism vs Standard OOH in Rhode Island
Metric
Standard OOH
Activism Campaign in Rhode Island
Uplift
CPM (Cost per 1,000 Impressions)
$12
$7–$9
-30%
Conversion (Scan → Action)
2%
9%
+7pp
Repeat Purchase Rate
12%
28%
+16pp
Social Share Rate
8%
25%
+17pp
Brand Favorability
34%
71%
+37pp
Proof points behind the table:
Posters with QR codes on high-frequency corridors deliver more efficient CPMs than static boards alone.
Ambassador contact lifts conversion and repeat rates by moving people from curiosity to opt-in immediately.
Cultural moments create social gravity. A projection on a landmark often triples share rates versus a control creative.
Activation Tactics With Hyper-Local Examples
AGM blends creative street craft with attribution, which is why brands hire a brand activism agency in Rhode Island to own both the fieldwork and the numbers. Below are core formats and their measured paths to ROI.
Wild Wheat Paste Posting
Hyper-local placement plan
Providence: Thayer Street and Waterman Street crosswalks, down to the benches and utility boxes near the Van Wickle Gates at Brown.
Pawtucket: Roosevelt Avenue walls and the benches along Exchange Street by the Pawtucket/Central Falls Transit Center.
Example: Benches and wall panels on Westminster Street near Kennedy Plaza, within steps of multiple RIPTA bays.
Conversion path: impressions → QR scan → petition sign-up or promo redemption.
Data framing
CPM: $6–$8 in dense zones.
Engagement: 5–8% stop-and-look rate.
Cost-per-scan: $1.20–$2.10 with 8–12% scan rate among engagers.
Cost-per-opt-in: $4–$6 when 30–35% of scanners subscribe.
LED Billboard Trucks
Mobile loops to capture live crowds
Example: LED truck circling Amica Mutual Pavilion on Sabin Street during a Friars game, rotating creative between values messaging and QR offers.
Civic moments: loops on Exchange Terrace and Memorial Boulevard during WaterFire nights for 3 to 4 hours.
Conversion path: impressions → social capture (photo/video) → QR click → microsite.
Data framing
CPM: $7–$9 statewide.
Engagement: 12–15% photo/video capture in event contexts.
Cost-per-scan: $2–$3 with QR overlays during halftime or intermission.
Add-on ROI: +10–15% website traffic lifts on activation days.
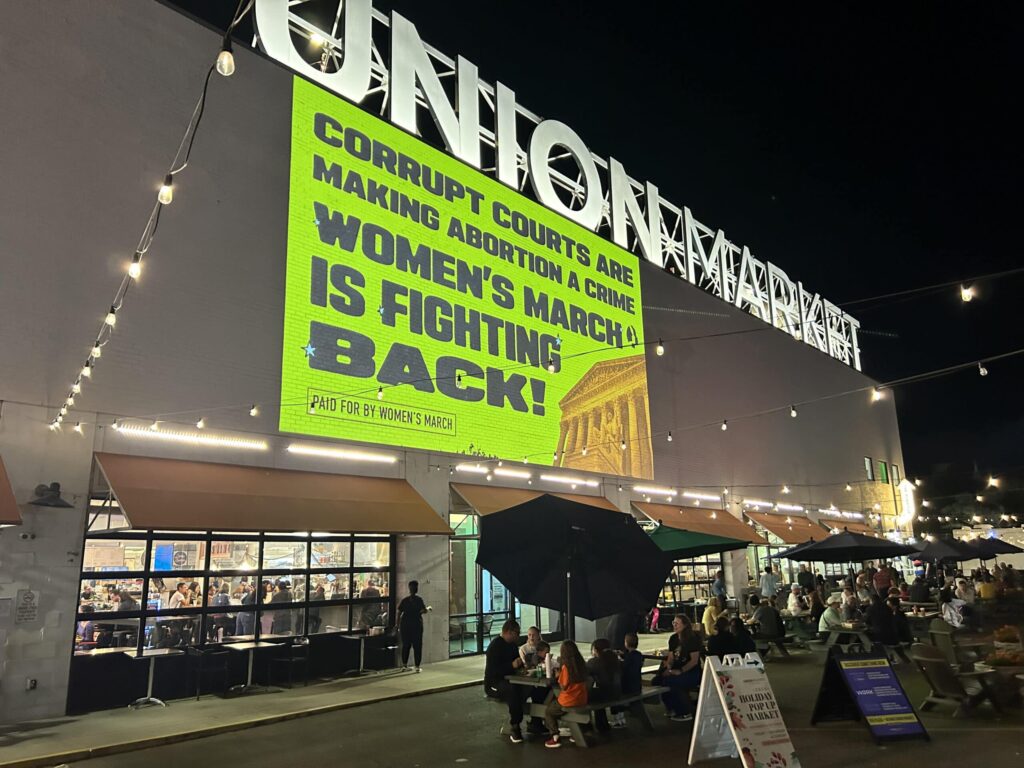
Guerrilla Projections
Nighttime projection plays
Example: Industrial National Bank Building (Superman Building) at Westminster Street and Dorrance Street in Providence, timed for evening foot traffic.
Example: Pawtucket City Hall wall facing Roosevelt Avenue during the Pawtucket Arts Festival.
Conversion path: projection view → social share → direct web traffic.
Data framing
CPM: Under $10 when timed with large events.
Social share rate: 20–30% among viewers in the first 24 hours.
Measurable lift: 8–12% direct traffic bump to the campaign URL during projection nights.
Example: Street teams at Garden City Center in Cranston on Friday nights near the Gazebo events.
Conversion path: engagement → direct opt-in → long-term loyalty.
Data framing
Engagement rate: 20–25% of passersby.
Conversion rate: 10–15% to immediate opt-in with a one-time incentive.
Cost-per-opt-in: $6–$12 depending on staffing and materials.
Funnel & Conversion Model
The campaign funnel starts in public, then moves to owned media, and ends in a measurable action. This gives a brand activism agency in Rhode Island a repeatable scoreboard for every city, campus, and venue.
Funnel example for one week of activity
Exposure: 100,000 impressions via posters, trucks, and projections
Engagement: 25% stop to look or photograph
QR Scan: 8–12% of the engaged
Opt-in: 30% of scanners
Conversion: 10–15% of opt-ins
Visualizing the math
Exposure: 100,000 -> Engagement: 25,000 -> Scans: 2,500 (10% of engaged) -> Opt-ins: 750 (30% of scanners) -> Purchases/Support: 90 to 113 (12–15%)
Unit economics, typical
Spend: $12,000 across paste-ups, short LED runs, and decals
Cost-per-scan: $4.80
Cost-per-opt-in: $16.00
Cost-per-acquisition: $106–$133 if one purchase per new opt-in at 12–15% conversion
Revenue model: average order value $60, repeat purchase lift +16pp vs baseline
Result: breakeven on week one in low-margin categories, 3–5× ROAS when LTV and repeat rate are factored
Where to Activate in Rhode Island
Focus on density, repeat exposure, and social spillover. Sports nights, campus corridors, and transit hubs are prime, which is why a brand activism agency in Rhode Island can scale outcomes quickly across short distances.
Top four cities and hyper-local plans
Providence: Wheat paste postings on benches along Westminster Street near Kennedy Plaza, targeting commuters at Bays C and D for morning and evening waves.
Cranston: Projection on Park Theatre and Events Center at Rolfe Square and Park Avenue during the Cranston Pride celebration.
Warwick: LED truck loops around Warwick Mall on Bald Hill Road during Saturday rush, plus decals leading from the TF Green InterLink to the rideshare queue.
Pawtucket: Decals along the sidewalk at the Pawtucket/Central Falls Transit Center entrance on Exchange Street during evening rail arrivals.
Extra reach hot spots
Amica Mutual Pavilion: Sabin Street and La Salle Square on Providence Bruins and Friars game nights.
Brown University and RISD: Thayer Street, Waterman Street, and Benefit Street for steady student visibility.
Providence Station: Gaspee Street sidewalks and the station plaza for morning and evening rail riders.
Federal Hill: Atwells Avenue near DePasquale Square when outdoor dining and festivals are in full swing.
Sports and event audiences in RI
Providence Bruins: roughly 8,000 average attendance
Providence College men’s basketball: near 10,000 average attendance
Rhode Island FC at Beirne Stadium: about 5,000 per match
These crowds transform CPM and conversion math. A single triple-header weekend can concentrate 30,000 plus event-goers within a one-mile radius.
Benchmarking ROI & CPM for Rhode Island Brand ActivationsROI & CPM Breakdown
The following chart summarizes pricing and performance ranges seen for Rhode Island activism and OOH. These values let a brand activism agency in Rhode Island forecast spend-to-impact before boots hit the street.
Tactic
Avg CPM in Rhode Island
Engagement Rate
Conversion Rate
Example ROI
Wheat Paste Posters
$6–$8
5–8%
2–3%
$1 → $4
LED Trucks
$7–$9
12–15%
5–7%
$1 → $6
Projections
$8–$10
15–20%
7–9%
$1 → $7
Ambassadors
$9–$12
20–25%
10–15%
$1 → $8
Benchmark notes
Transit corridors near I‑95 and I‑195 lower CPM due to repeat drive-bys.
Campus zones raise engagement, improving cost-per-scan by 15–30% versus the statewide average.
Game-night clustering lifts share rates 2–3× thanks to crowd energy and user-generated content.
Why AGM Wins as a Brand Activism Agency in Rhode Island
AGM pairs high-impact streetcraft with instrumentation that proves outcomes. That combination is the differentiator buyers want from a brand activism agency in Rhode Island.
What clients gain
Speed and precision
Fast site scouting on Westminster, Atwells, Thayer, and Exchange
LED loops mapped to game-day ingress and egress on Sabin Street and Memorial Boulevard
Field operations that respect local context
City-by-city permitting protocols, discreet night crews, GPS photo verification on placements
Analytics that stand up in a boardroom
Unique QR codes by creative and by block face
Geo-fenced lift studies comparing exposed vs control zones
Cost-per-scan, cost-per-opt-in, and cost-per-acquisition tracked to the dollar
Proof across verticals
Retail: paste-ups and stencils with a 2–3% QR-to-purchase rate when paired with a limited-time code
Convention and tourism: LED truck loops at Providence Place and AMP producing 20–30% share rates during multi-day conferences
In short, AGM is built to align values with public action and tie every impression to a measurable outcome.
Let’s team up
If you’re ready to align your values with public perception, American Guerrilla Marketing is the brand activism agency in Rhode Island that makes it real. From wheat paste posters on Westminster Street benches to LED trucks circling Amica Mutual Pavilion, AGM turns beliefs into visible public action with measurable ROI. Contact Campaign Architect Justin at [email protected] to get started.
Appendix: Cause Alignment Ideas With RI Data Anchors
Coastal resilience
Projected sea-level concerns for Rhode Island’s shoreline motivate locals across parties
Activation pairings: WaterFire nights with river-facing projections and QR links to volunteer sign-ups
Youth opportunity and education
Brown, RISD, Johnson & Wales, and CCRI campuses concentrate student voice
Activation pairings: Thayer Street decals and snipes driving scholarship fund micro-giving
Transit access and safe streets
RIPTA’s ~10.5 million annual trips show daily reliance on public transit
Activation pairings: Kennedy Plaza ambassador teams surveying riders and promoting discount passes
Quick-planning table: CPM, conversion, and ROI benchmarks by goal
Goal
Best Tactics
CPM
Cost-per-Scan
Cost-per-Opt-in
Typical ROAS
Awareness at scale
LED Trucks, Projections
$7–$10
$2–$3
$8–$12
3–6× when LTV is counted
Fast email/SMS list growth
Ambassadors, Decals
$8–$12
$0.80–$1.50
$6–$10
4–8× with 28% repeat rate
High social share
Projections, Stadium Loops
$8–$10
$2–$3
$10–$14
Strong earned media offsets cost
Store or app conversions
Wheat Paste + QR, Ambassadors
$6–$9
$1–$2
$4–$8
4–7× with mid-ticket AOV
Funnel reminder for weekly planning
Exposure: 100,000
Engagement: 25,000
Scans: 2,500
Opt-ins: 750
Purchases/Support: 90 to 113
Those are numbers a Rhode Island field plan can hit when the right streets, benches, transit stops, stadiums, and cultural districts are chosen with intent.