American Guerrilla Marketing
Nationwide serivce
Media planning, media buying, billboard advertising, & guerrilla marketing
Guerrilla marketing in San Jose, California works because the city runs on routine tech commuting, downtown walkability, university corridors, nightlife pockets, and repeat daily circulation tied to offices, transit, and events. San Jose isn’t a single dense core—it’s a network of compact nodes where the same sidewalks, plazas, light-rail stops, patios, and campus edges are encountered again and again. The advantage here isn’t sheer reach; it’s disciplined placement inside routes people already repeat.
Our guerrilla marketing campaigns in San Jose are built from the street up. From wild wheatpasting and posters to street teams, product demonstrations, beer coasters, survey crews, snipe advertising, transit-adjacent placements, projections, and mobile media, every execution is selected based on real pedestrian behavior and repeat exposure—not generic media assumptions.
01


Jaime Morgans
5/5 Google Review
02
Heather Cummings
5/5 Google Review
We execute guerrilla marketing in San Jose block by block, mapping how tech workers, students, nightlife crowds, commuters, and event audiences circulate through the city. San Jose’s downtown core, Diridon transit hub, university corridors, arts districts, and mixed-use neighborhoods create predictable movement loops that reward disciplined physical placement.
Our process includes location scouting, surface evaluation, placement strategy, production guidance, execution, and reporting. Guerrilla marketing in San Jose performs best when campaigns integrate into daily routines—commutes, class schedules, dining, nightlife, and events—rather than interrupt them.
Mobile LED billboard trucks move messaging through downtown corridors, nightlife zones, and event routes so campaigns travel with crowds.
Read More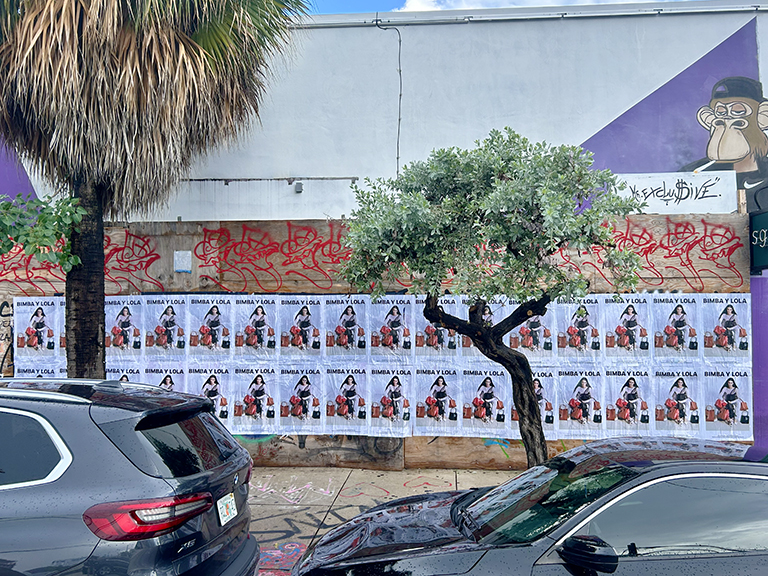
Static mobile billboard trucks provide sustained visibility along major corridors during multi-day promotions.
Read More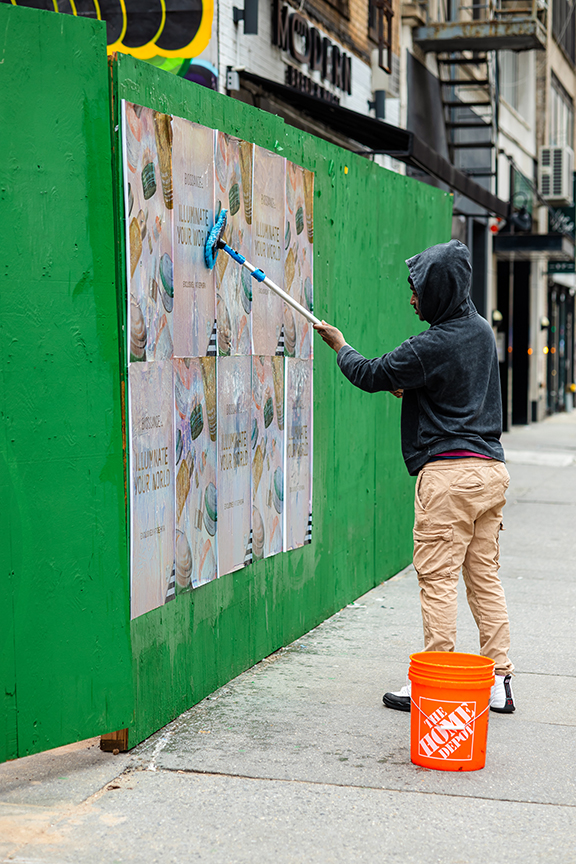
Brand ambassadors deliver face-to-face engagement in high-density pedestrian environments such as nightlife and arts districts.
Read More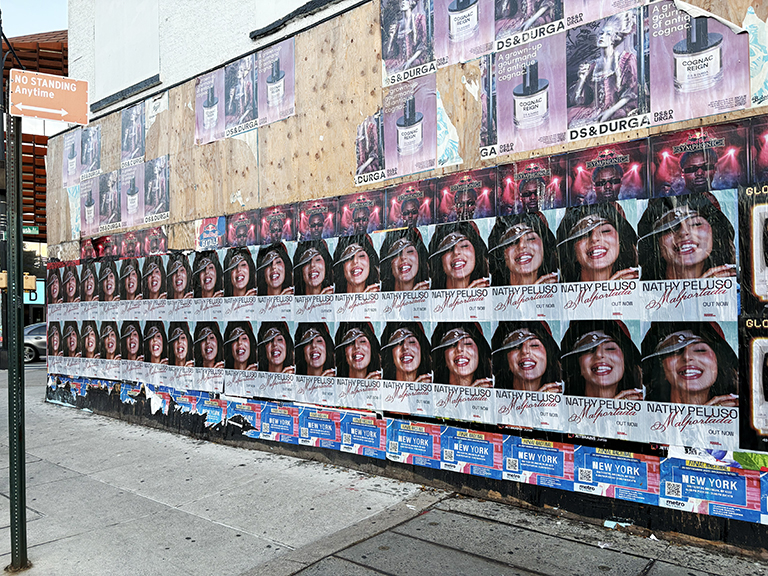
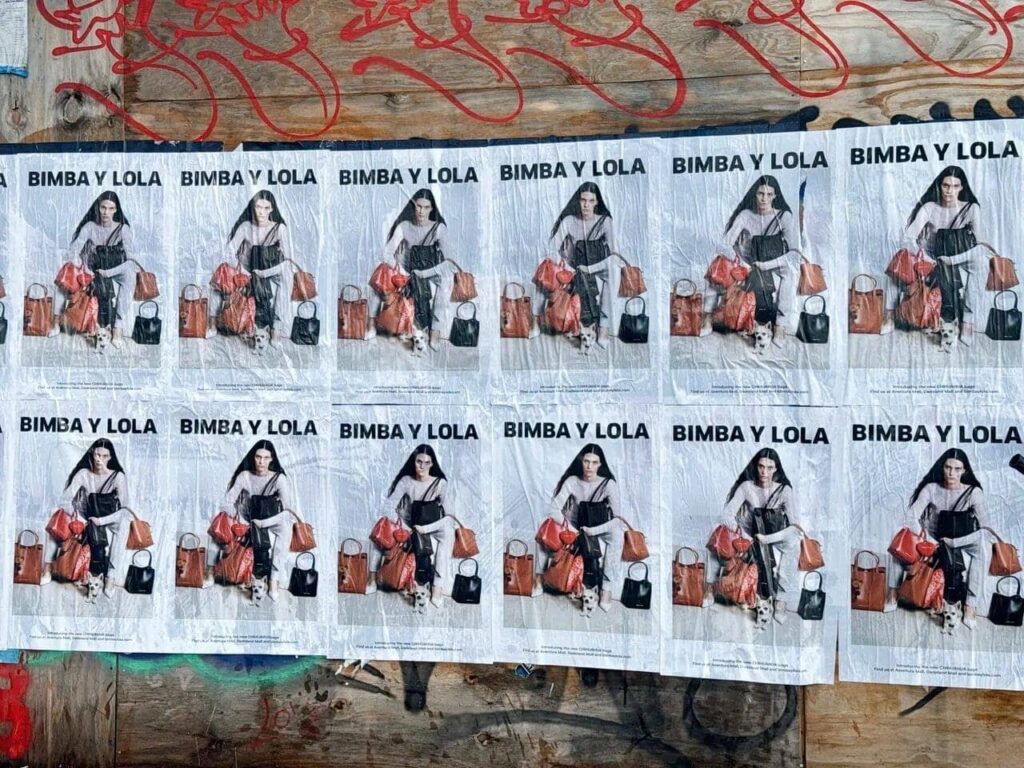
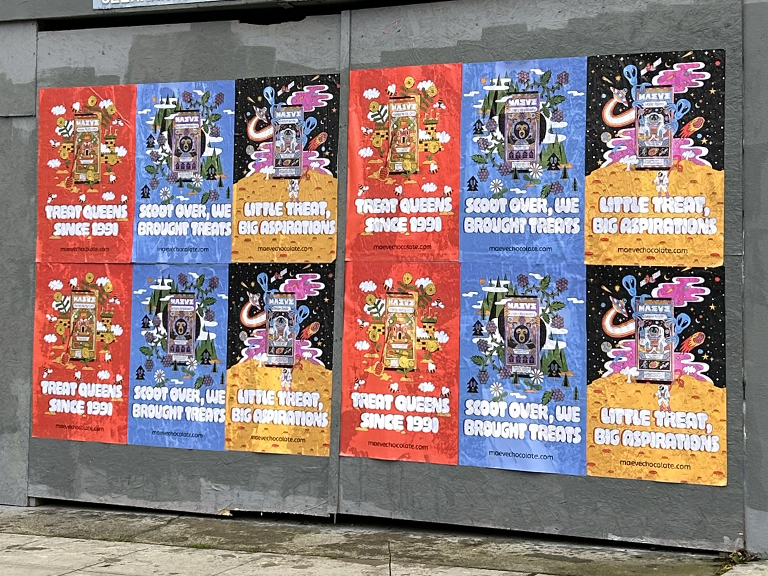
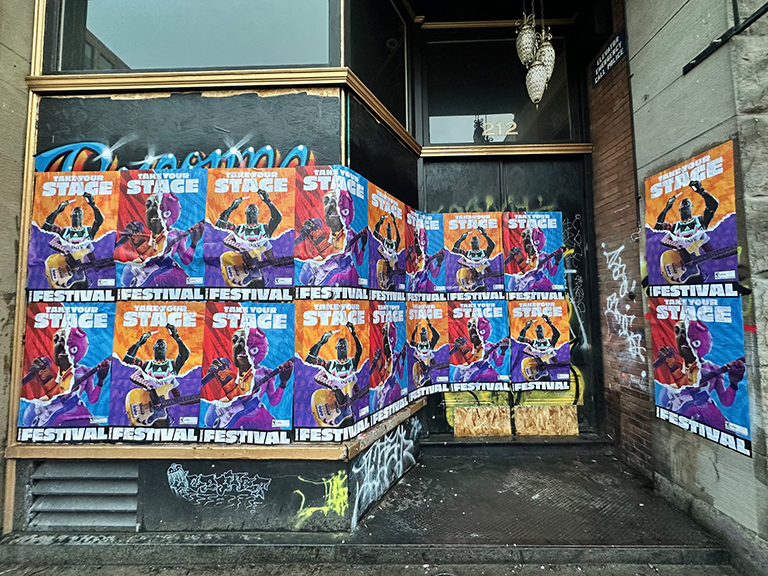
Wild wheatpasting and posting installs posters on brick and concrete surfaces along side streets, warehouse corridors, nightlife zones, and event routes for repeat exposure.
Read More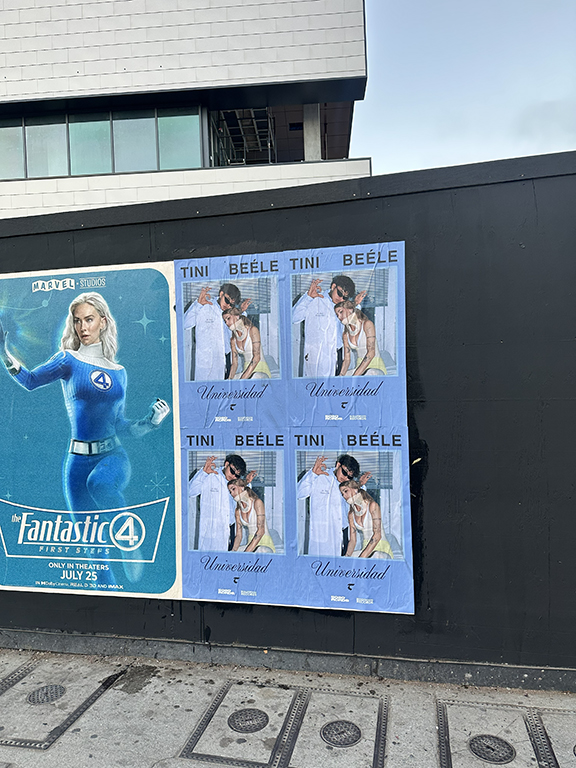
Transit-adjacent placements reach commuters and students along habitual daily routes.
Read More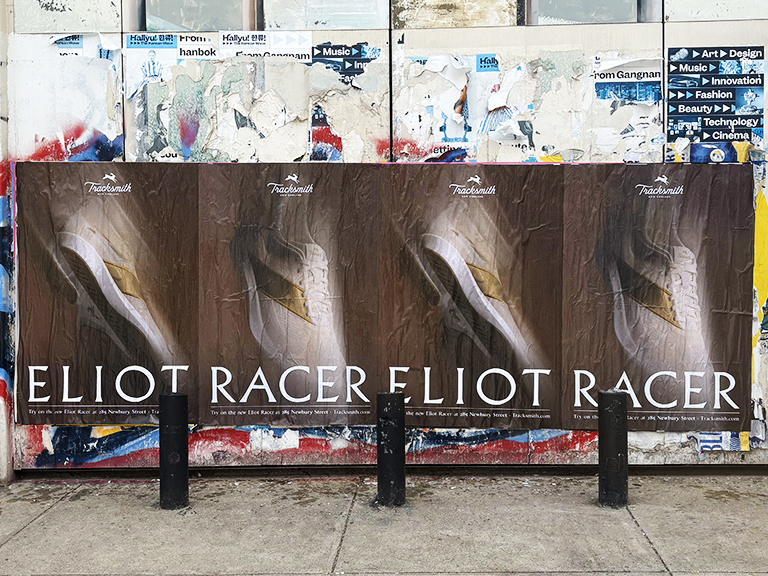
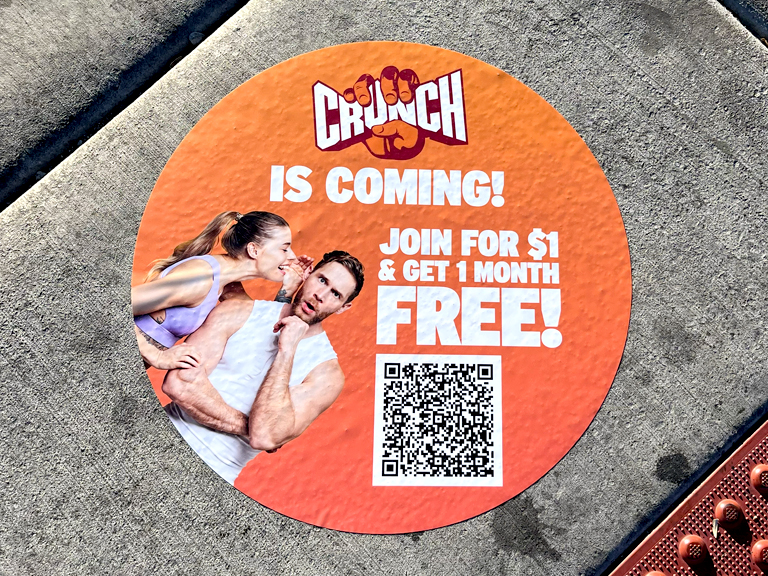
Sidewalk stencils place messaging where people slow down, queue, or wait, reinforcing recall at ground level.
Read More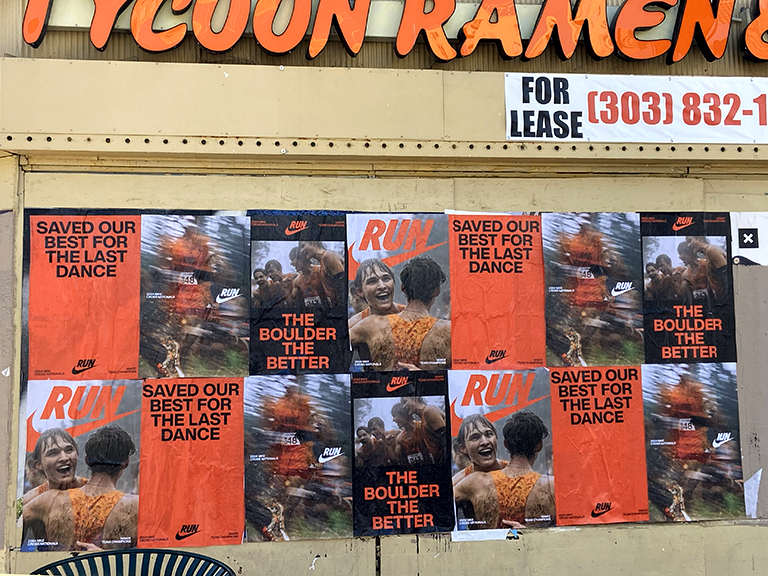
Mobile pop-ups and branded vehicles create immersive brand experiences near festivals and retail clusters.
Read More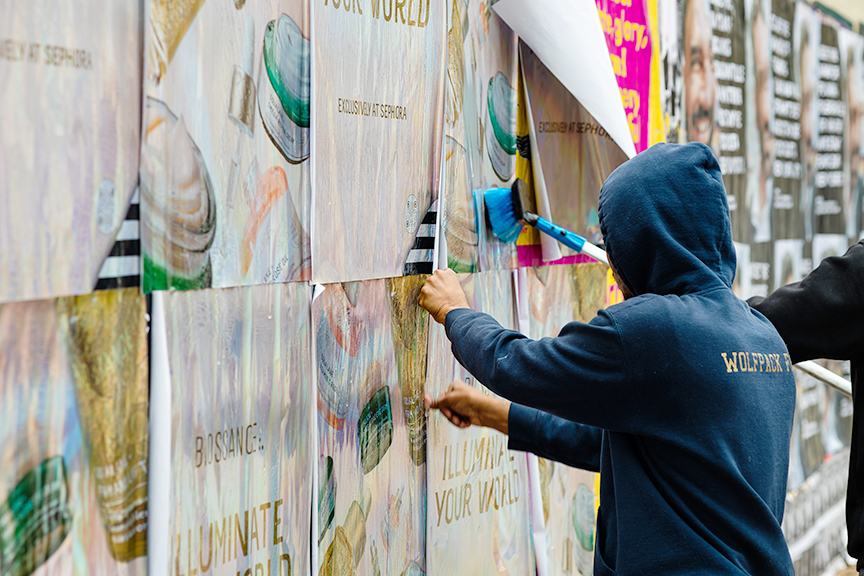
Bus advertising delivers rolling visibility across commuter routes and urban corridors.
Read More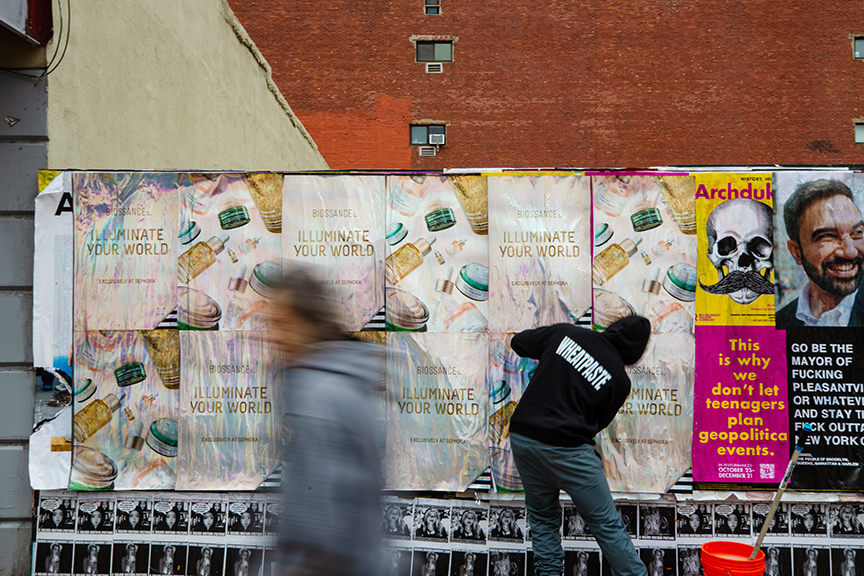
Bus stop placements capture attention during dwell time along busy pedestrian paths.
Read More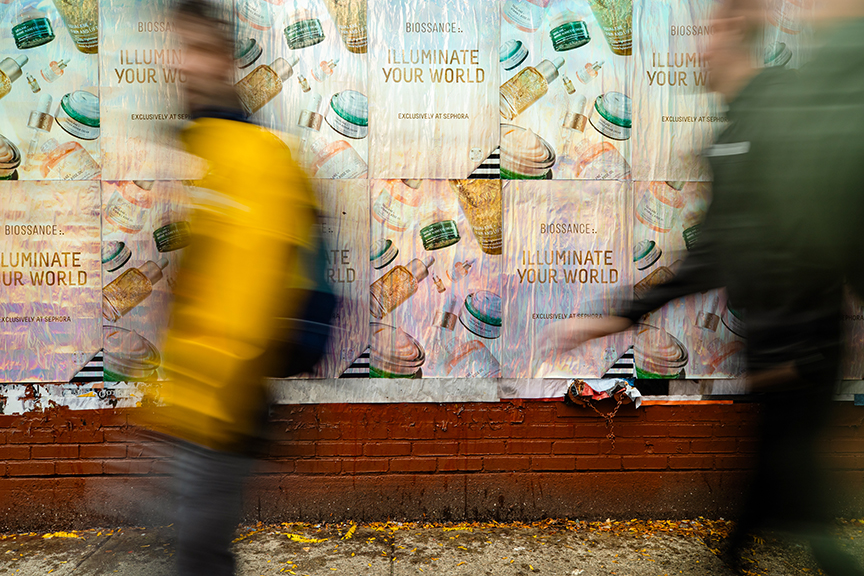
Projection media activates large urban surfaces near nightlife and event zones for nighttime impact.
Read More
Murals provide long-term visual presence and neighborhood-anchored storytelling.
Read More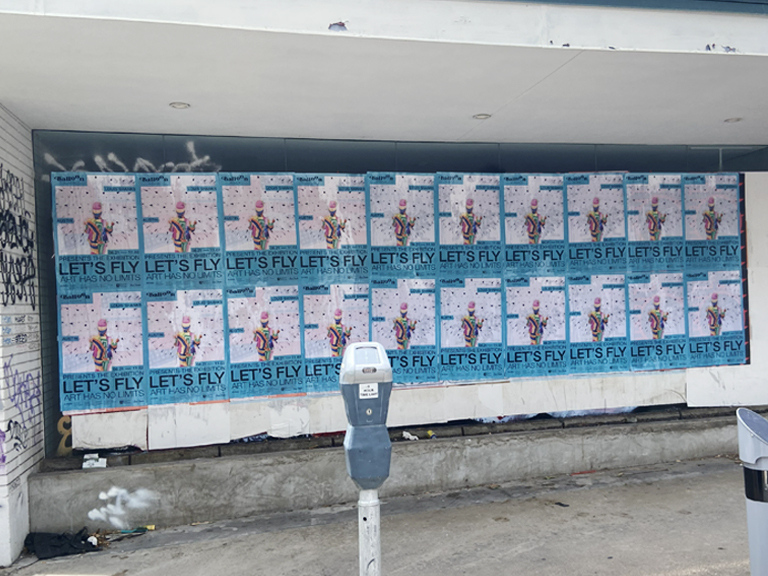
Beer coasters inside bars and restaurants deliver tactile exposure during extended dwell time.
Read More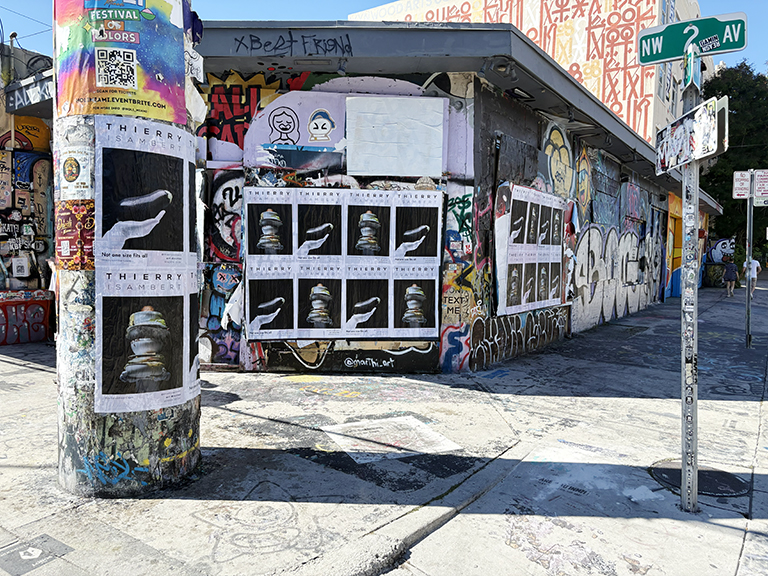
Vehicle wraps turn cars, vans, and trucks into moving brand assets circulating daily.
Read More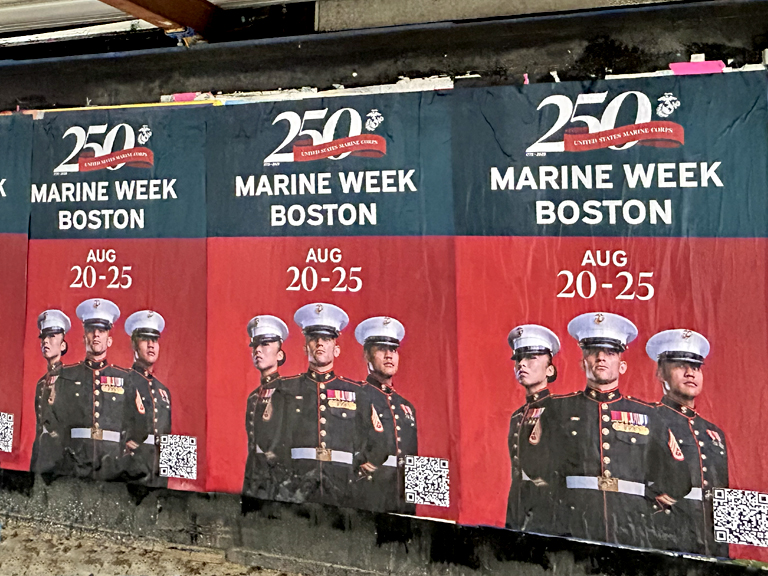
Door hangers deliver targeted messaging directly to residential neighborhoods.
Read More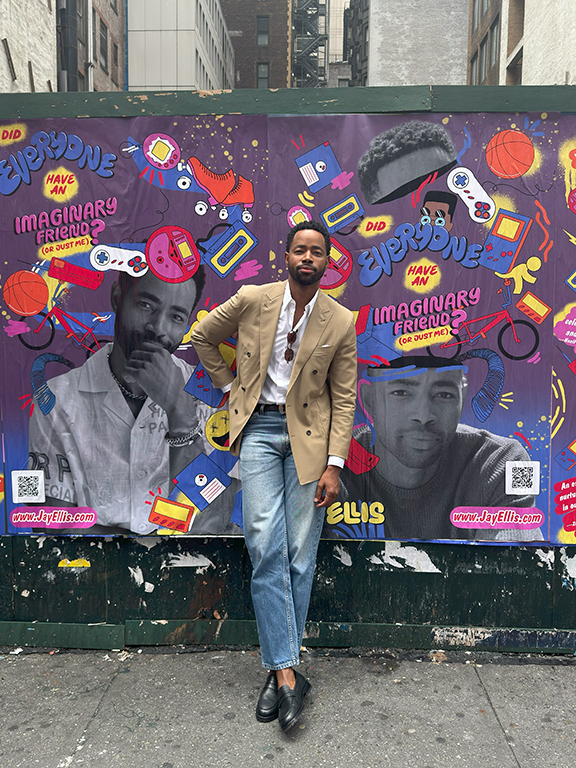
Bathroom advertising places messaging in high-dwell environments such as bars, venues, and event spaces.
Read More
Taxi advertising delivers repeated street-level visibility across activity corridors.
Read More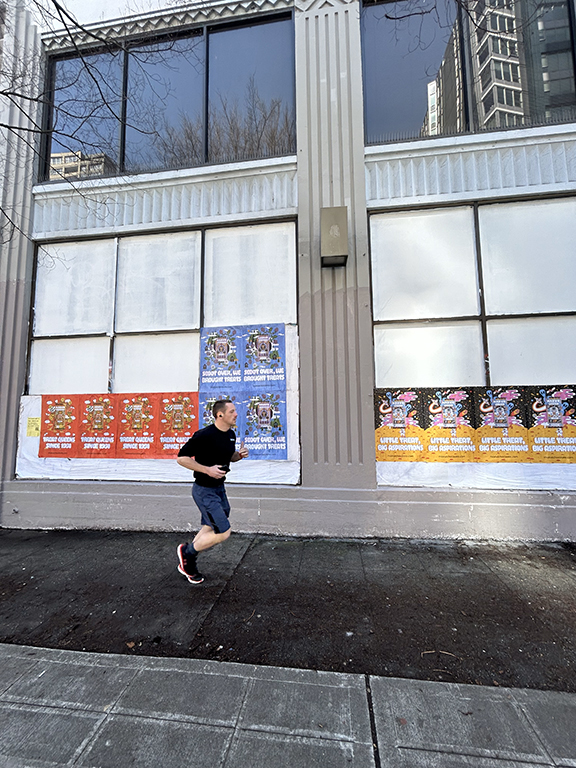
Taxi TV reaches riders during uninterrupted travel time.
Read More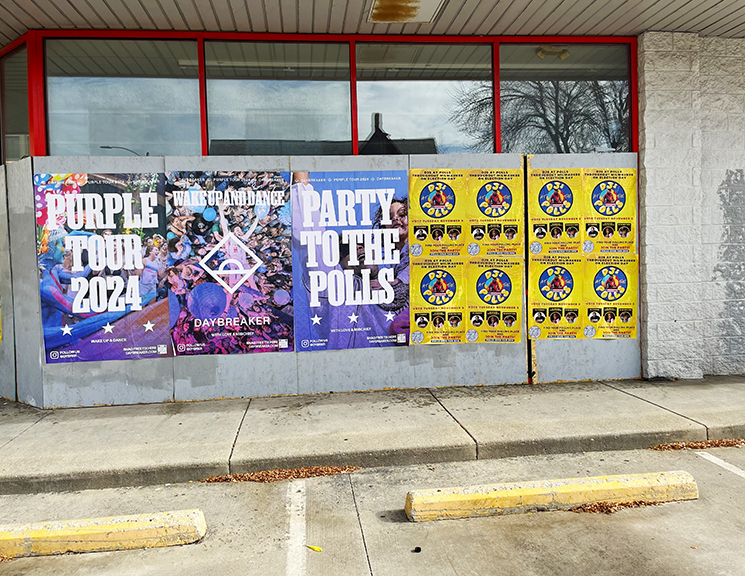
Pedicab advertising activates nightlife and entertainment zones with close-range exposure.
Read More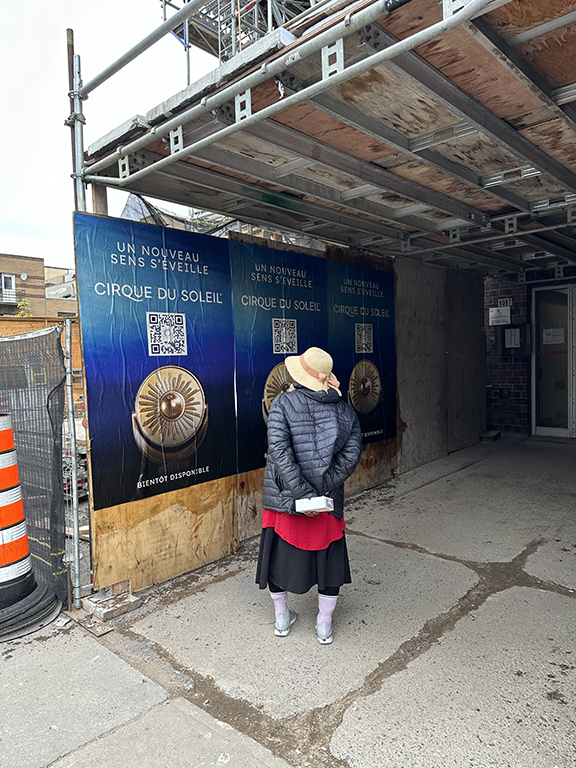
Event staff and demonstrators engage audiences through sampling and education.
Read More
Flyer distribution targets pedestrian corridors, campuses, nightlife zones, and event approaches.
Read More
Street surveys capture real-world sentiment directly from pedestrians and event attendees.
Read More
Drone light shows deliver large-scale visual moments for major civic and cultural events.
Read More
Snipe advertising stacks small-format placements along sidewalks and intersections to densify exposure.
Read MoreAward Winning Personalized Service
You will get thoughtful, devoted, and individualized attention from our experienced, qualified, and professional personnel. Being one of the most illustrious agencies in Brooklyn, New York, American Guerrilla Marketing has been awarded the Best of Brooklyn title.
Nationwide
Industry City, Brooklyn, New York 11232
American Guerrilla Marketing
Hours
Mon - Fri: 9 AM - 5 PM
Sat & Sun: Closed
Automate your campaign with AGM’s Request for Proposal Builder. Simply answer a few quick questions about your campaign goals, markets, and timeline, and the system will generate a tailored presentation with recommended strategies, quantities, and pricing. Click the RFP Builder to instantly receive your customized proposal.
Guerrilla marketing performance in San Jose, California is measured at the neighborhood level using U.S. Census population data, observed pedestrian behavior, and standard out-of-home impression modeling. This allows campaigns to estimate how often messaging is seen over one, two, and four weeks when installed in walkable, repeat-traffic environments.
Rather than relying on population size alone, we compare neighborhood population against exposure frequency and engagement response. In San Jose, compact districts anchored by transit, universities, nightlife, or downtown offices consistently outperform larger residential zones because people revisit the same locations multiple times per week.
| Neighborhood | Population | Impressions (1 Week) | Impressions (2 Weeks) | Impressions (4 Weeks) | Estimated Engagements | Engagement Rate |
| Downtown San Jose | 13,000 | 200,000 | 400,000 | 800,000 | 280,000 | 35% |
| SoFA District | 9,500 | 160,000 | 320,000 | 640,000 | 224,000 | 35% |
| San José State University Area | 24,000 | 280,000 | 560,000 | 1,120,000 | 392,000 | 35% |
| Diridon Station / SAP Center | 15,000 | 220,000 | 440,000 | 880,000 | 308,000 | 35% |
| Santana Row / Valley Fair | 18,000 | 260,000 | 520,000 | 1,040,000 | 364,000 | 35% |
| North San Jose Tech Corridors | 22,000 | 300,000 | 600,000 | 1,200,000 | 360,000 | 30% |
Impressions represent estimated visual exposures based on placement density and repeat movement. Engagements reflect real-world responses such as QR scans, survey participation, flyer acceptance, sampling interaction, or recall-driven action.
All impression and engagement figures are estimates provided for planning purposes only. Actual results vary by creative quality, placement density, timing, weather, neighborhood behavior, and execution. No performance outcomes are guaranteed.
Downtown San Jose concentrates office workers, nightlife, restaurants, theaters, and transit into a compact, walkable grid.
Wild wheatpasting and poster advertising perform best on brick and concrete service walls along San Pedro Street between Santa Clara Street and San Fernando Street, where surfaces can support 6 to 10 posters in vertical grids and are crossed repeatedly during lunch, happy hour, and late-night activity.
Street teams and man-on-the-street surveys convert well at San Pedro Street & Santa Clara Street, where pedestrian traffic slows between parking structures, bars, and light-rail stops.
Snipe advertising reinforces linear exposure along Santa Clara Street between Market Street and 1st Street, a corridor walked multiple times per day.
The SoFA District generates dense evening and weekend foot traffic tied to galleries, bars, restaurants, and First Friday events.
Beer coaster advertising performs best inside venues along South 1st Street between San Carlos Street and Reed Street, where dwell time and repeat visits are high.
Alley walls and service corridors near South 2nd Street support 5 to 8 posters per surface, reinforcing visibility across multiple nights.
Street teams perform best near South 1st Street & San Carlos Street during gallery openings and events.
The SJSU area produces constant weekday pedestrian movement tied to class schedules, housing, dining, and transit.
Wild wheatpasting performs best on retaining walls and utility surfaces along East San Fernando Street near 7th Street, supporting 7 to 11 posters at eye level.
Survey teams and flyer distribution convert best near East San Fernando Street & 7th Street during class-change windows. Product demonstrations perform well near campus retail pads where students naturally pause.
Diridon Station and SAP Center generate predictable surges tied to commuting, Sharks games, concerts, and major events.
Street teams and man-on-the-street surveys convert well at Diridon Station Plaza, capturing commuters and fans before and after events.
Posters and wild posting perform well on concrete surfaces along Autumn Street approaching SAP Center, supporting 5 to 8 posters per wall.
Santana Row and Valley Fair produce steady daily foot traffic tied to shopping, dining, offices, and events.
Beer coaster distribution performs best inside venues along Santana Row near Olsen Drive, where repeat visits reinforce recall.
Street teams perform best near Olsen Drive & Stevens Creek Boulevard, capturing pedestrians transitioning between retail and dining.
North San Jose generates heavy weekday movement tied to office parks, lunch traffic, and commuting patterns.
Street teams and survey crews convert best near Zanker Road & North 1st Street, where workers slow during lunch and after work.
Snipe advertising along North 1st Street between Zanker Road and River Oaks Parkway reinforces repeated commuter exposure.
Guerrilla marketing works in San Jose because movement is habitual and node-based. Tech workers, students, commuters, and nightlife crowds repeatedly circulate between offices, campuses, transit hubs, dining districts, and event venues. When guerrilla marketing is executed cleanly and strategically, it becomes part of the city’s visual rhythm rather than background clutter.
San Jose’s mix of technology professionals, students, nightlife, transit-oriented development, and event traffic makes it especially effective for political marketing, grassroots organizing, local initiatives, and community engagement campaigns.

AGM ran a combined wheat paste and sidewalk stencil campaign for Biossance across the beauty and wellness corridors of New York and Los Angeles. The multi-format approach placed Biossance’s brand in the physical environment of its target consumer across two major markets simultaneously.
Result: Multi-format street presence across the core beauty consumer corridors in both NYC and LA markets, with full GPS documentation and post-campaign reporting
Because repeated foot traffic between Santa Clara Street and San Fernando Street creates physical recall digital placements cannot match.
Arts events and nightlife create long dwell time and repeat exposure during evenings and weekends.
Street teams convert strongest at East San Fernando Street & 7th Street where student movement naturally slows.
Commuters and event crowds pass the same routes before and after games and concerts.
Linear commuter movement causes repeated exposure as workers travel the same route daily.
Yes, especially near campuses, downtown civic corridors, transit hubs, and major events.
Most service walls support between 5 and 10 posters depending on surface width and visibility.
Nightlife areas generate longer dwell time and repeated visits across multiple evenings.
Through GPS pinning, photo documentation, and placement reporting tied to exact streets and locations.
Yes, when executed responsibly and strategically with proper placement discipline.